Kubernetes observability in 2026, with OpenObserve 1.0 as the backend
Why the backend is where Kubernetes observability cost lives, what an object-storage and columnar-file backend does differently, and a hands-on run of OpenObserve 1.0 on a kiac cluster.
On this page (19)
- Why the backend is where the money goes
- What we run today, and what we should ask for
- How OpenObserve is built
- A log line goes in
- The index is a file next to the data
- A query comes out
- What 1.0 adds
- Running it: a whole cluster into one binary
- 1. Cluster and OpenObserve
- 2. Collect everything the cluster emits
- 3. An application with traces and logs
- 4. Parse the log body at ingest
- 5. Look at the files
- 6. Ask it questions over MCP
- 7. Break an SLO
- 8. Compaction, the bill, and how fast it answers
- Sharp edges
- Wrapping up
- Links
TL;DR: Collecting telemetry from Kubernetes is solved, paying to store and search it is not, and this post is about why the backend is where the cost lives, what a backend built on object storage and columnar files does differently, and what that looks like when you run OpenObserve 1.0 on a real cluster. I ran it on a three node kiac cluster on my Mac, read the parts of the source that matter, and hit one real bug on the way.
Every Kubernetes cluster you run is quietly producing four kinds of evidence about itself: container logs on every node, metrics from the kubelet and kube-state-metrics, traces if your apps are instrumented, and Kubernetes events, which most clusters throw away after an hour. When a pod restarts at 3 am you usually do have the data somewhere, the real question is where it went and whether you can afford to keep it there.
That second question is what we are after, so let's look at the problem, what people run today, one backend built differently, and then run it. Where a number comes from the vendor, I say so.
Why the backend is where the money goes #
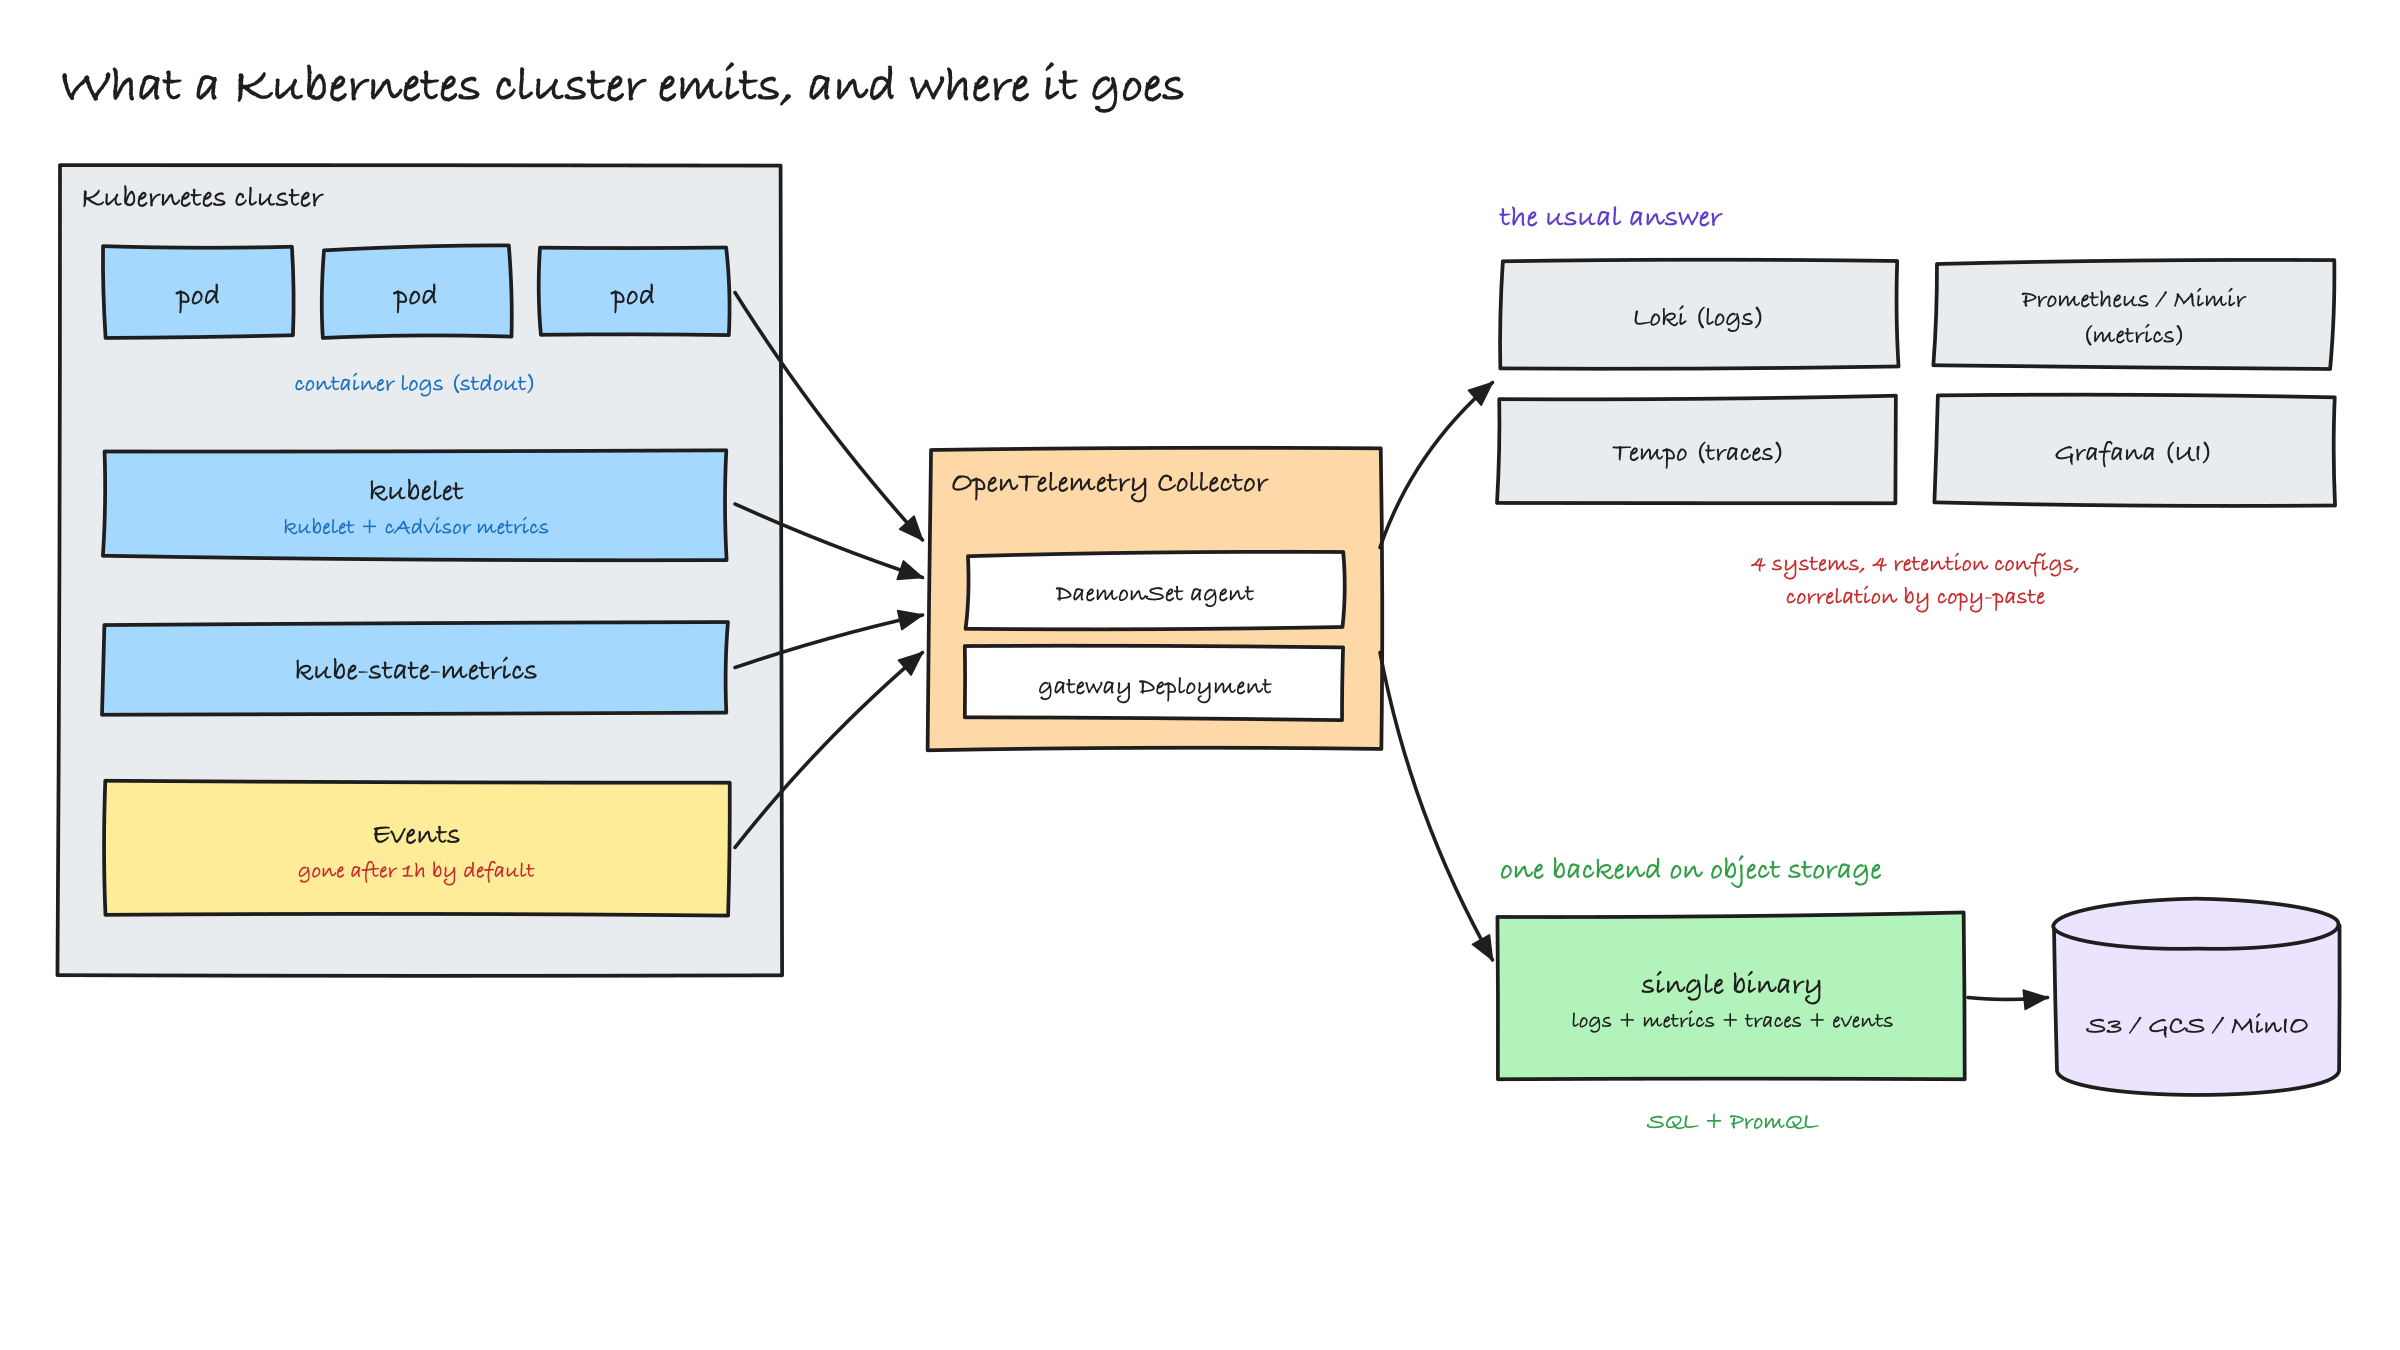
The collection side is done. In 2026 you run the OpenTelemetry Collector as a DaemonSet on every node, it reads container stdout, scrapes the kubelet, watches the API server for events and receives OTLP from your apps. The Grafana Labs Observability Survey 2026 (1,363 respondents) shows how settled that is, and where the pain moved:
| What the survey found | Share |
|---|---|
| Use OpenTelemetry for metrics / traces / logs | 57% / 50% / 48% |
| Name complexity and overhead as the biggest observability concern | 38% |
| Name cost as a top-three concern | 31% |
| Say cost is a priority when picking new tools | 65% |
So why is the backend the expensive part? Because of how the two classic designs store data.
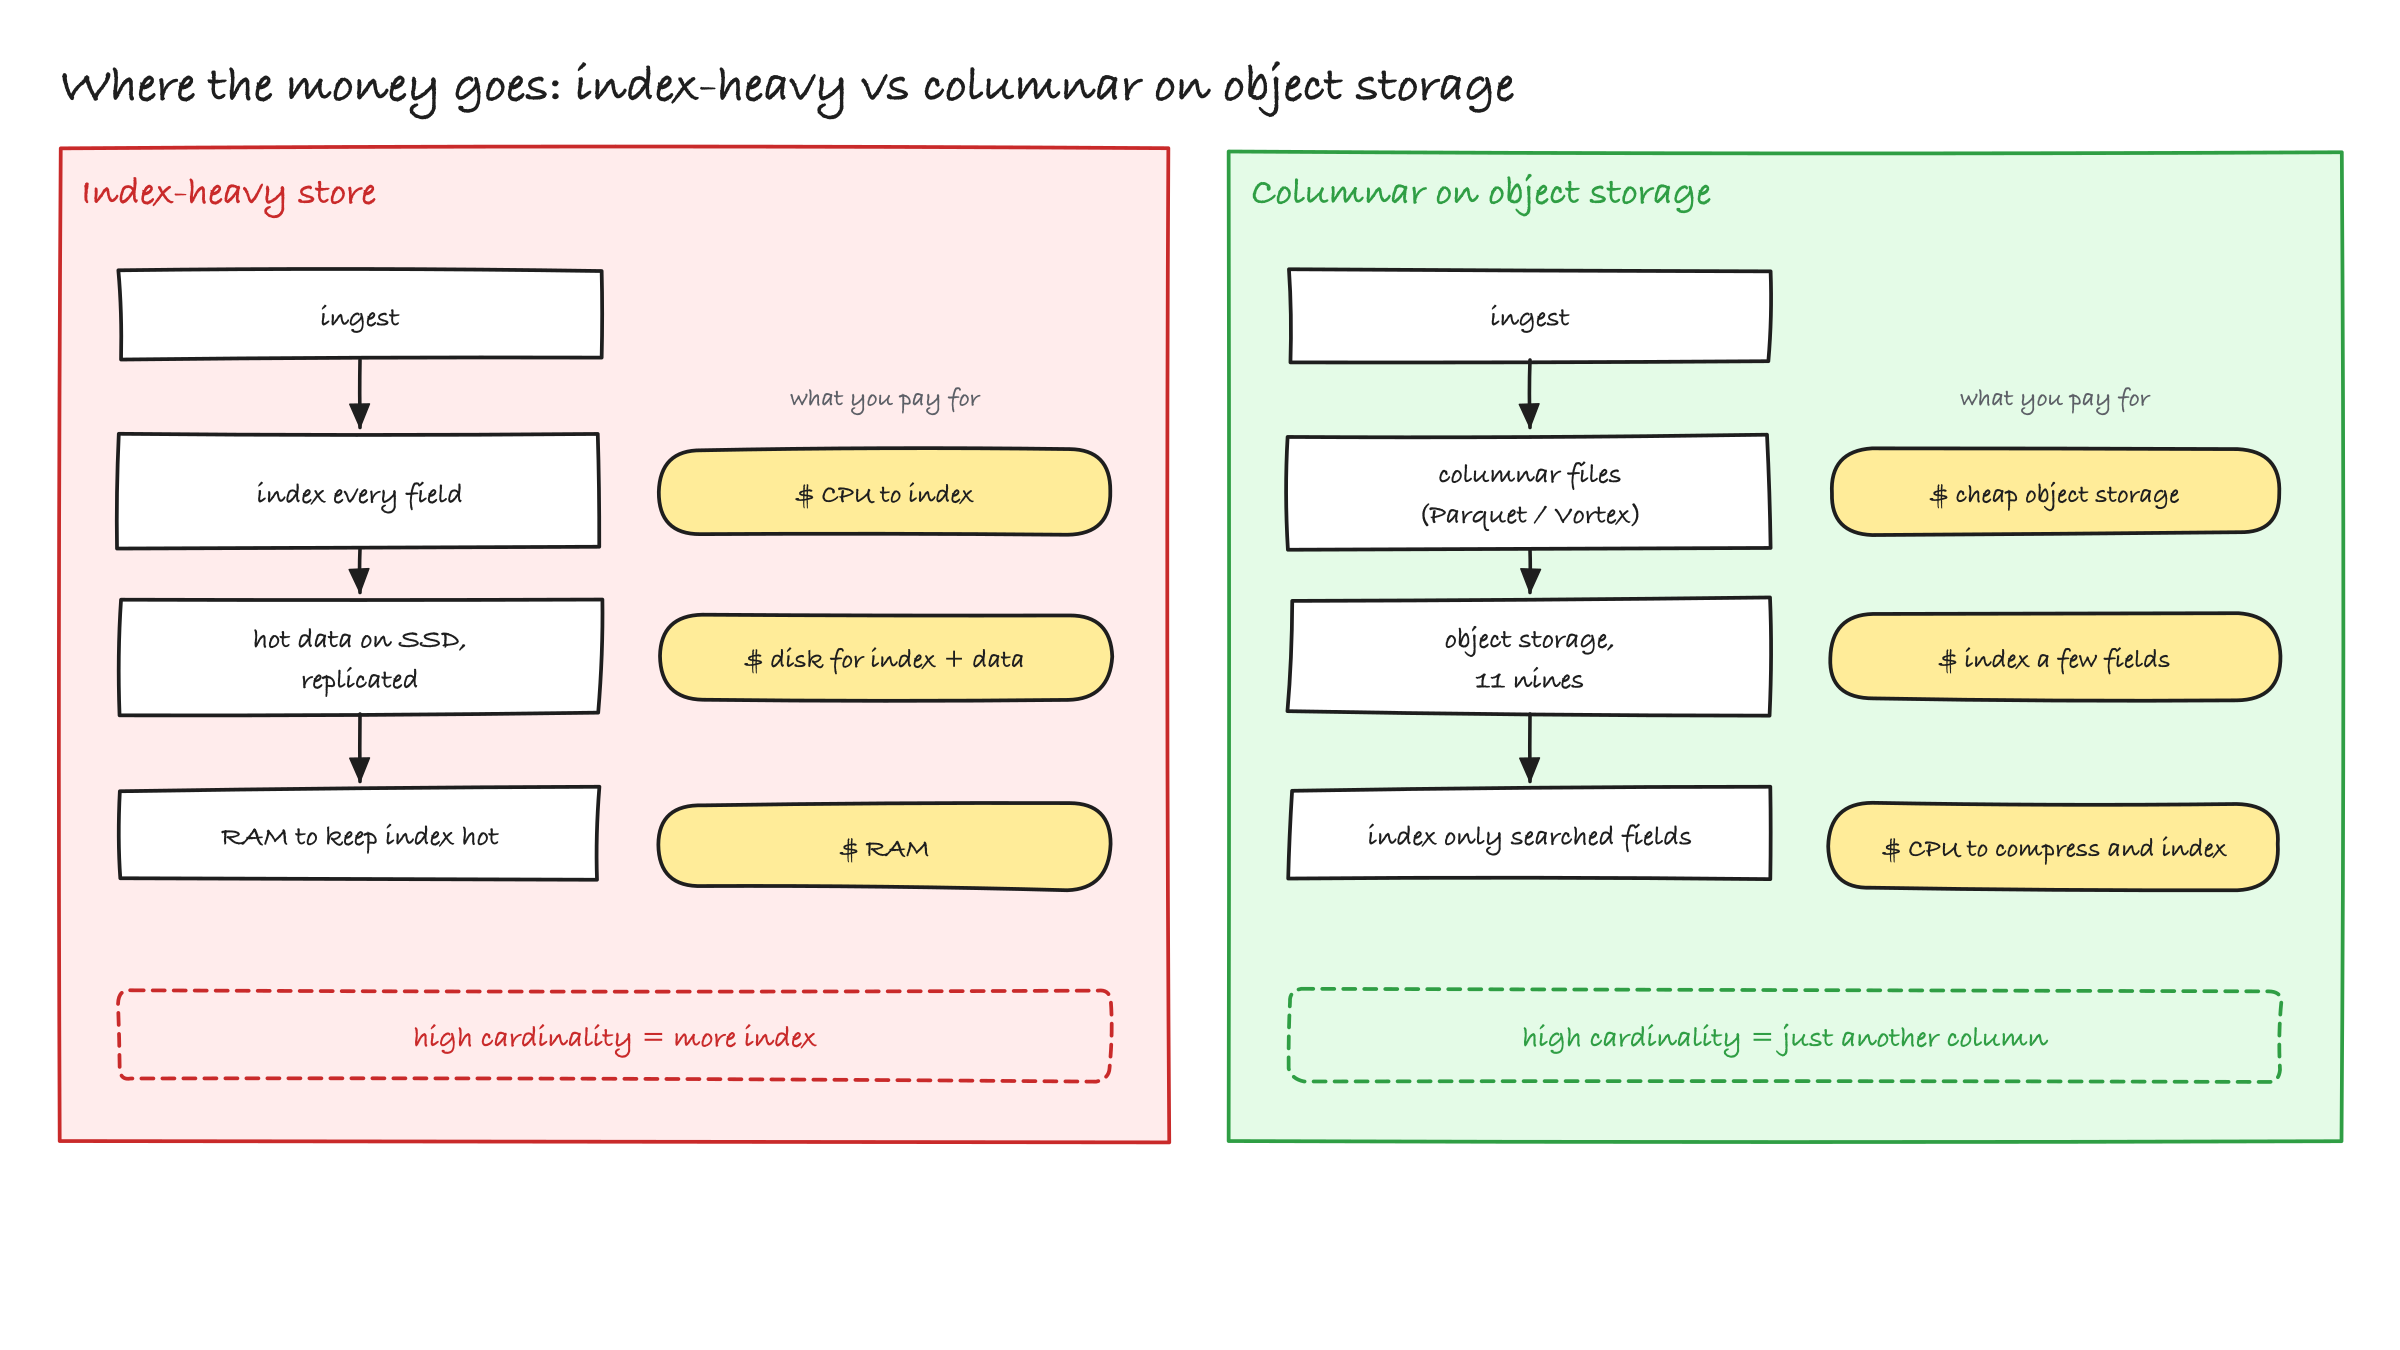
Index-heavy stores like Elasticsearch build an inverted index over every field at ingest and keep hot data on replicated SSD. You pay three times: CPU to build the index, disk for index plus data plus replicas, and RAM to keep the index hot. Every new high-cardinality field makes it worse.
Label-based stores like Loki went the other way. They index a handful of labels and scan the rest. That is cheap until you need to query by something with many values. A pod name, a request id, a trace id: the moment you want those as query dimensions you are told to keep cardinality down, and the thing you most want to search by becomes the thing you cannot index.
SaaS per-GB pricing adds a third pressure. Every debug log line is a line item, so teams sample and drop, which defeats the point of collecting. And the data is getting wider: LLM traces carry tokens, prompts and cost, GPU nodes emit per-process metrics, agents make dozens of model calls per user action.
What we run today, and what we should ask for #
The default backend most of us know is the LGTM stack: Loki, Prometheus or Mimir, Tempo, Grafana. It works, and it is what I learned on. It is also four systems with four data models and four retention configurations, and correlation mostly happens by copying a trace id from one screen into another. Elastic gives you full-text search on every field and the hardware bill that comes with it. Datadog gives you everything and charges per host, per custom metric and per indexed log.
The data warehousing world solved a similar problem a few years ago. Think of your phone: you do not keep every photo you ever took on the fast internal storage, you keep them in cheap cloud storage and pull down the ones you need. Object storage is cheap and built for eleven nines of durability, columnar file formats compress well, and modern query engines scan them fast. Iceberg, DuckDB and the cloud warehouses are all built on this. An observability backend built the same way shrinks the expensive tier to only what you search, and puts everything else in a bucket.
That gives us a bar to hold any backend to:
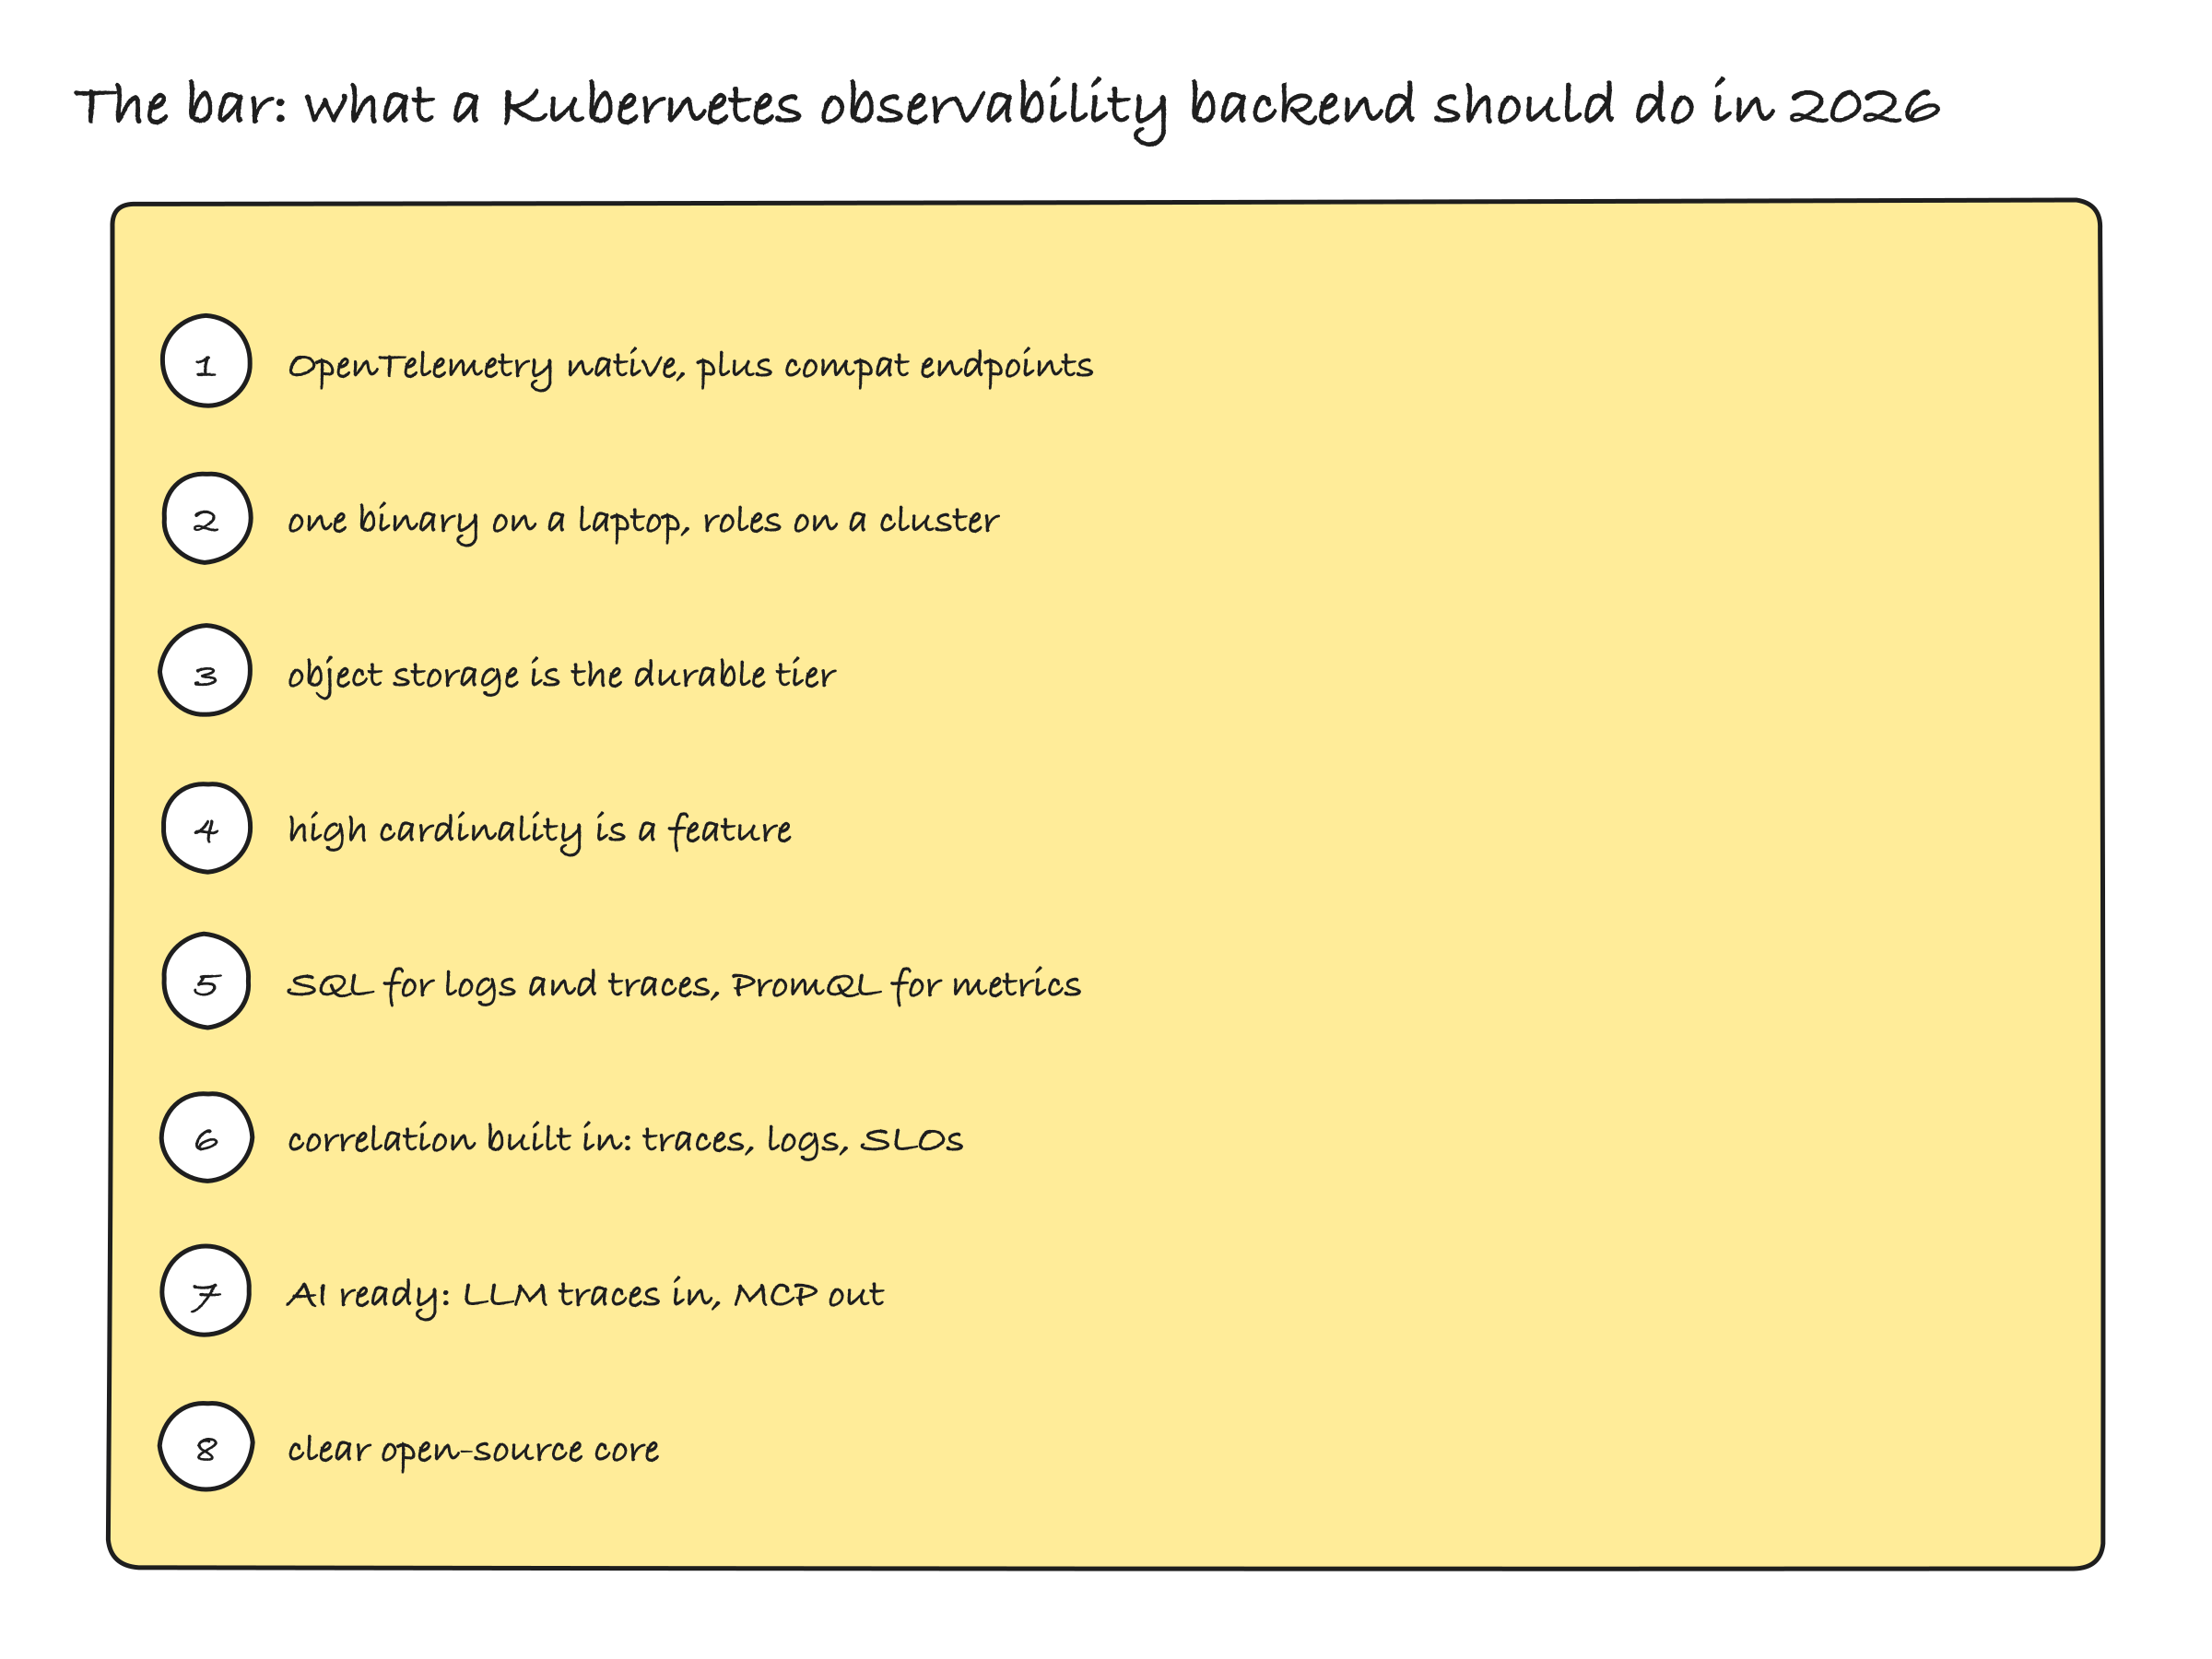
- OpenTelemetry-native ingest, plus compatibility endpoints so existing agents keep working.
- One process on a laptop, roles on a cluster, same binary.
- Object storage as the durable tier, in an open file format, so the data outlives the tool.
- High cardinality as a feature: index where you search, columnar scan everywhere else.
- SQL for logs and traces, PromQL for metrics.
- Correlation built in: trace to logs in one click, alerts that understand SLOs.
- Understands LLM traces coming in, and exposes itself to agents over MCP going out.
- A clear open-source core.
How OpenObserve is built #
OpenObserve is a single Rust binary, licensed AGPL-3.0. It ingests logs, metrics and traces (LLM traces included) over OTLP, RUM from its browser SDK, and keeps compatibility endpoints for Elasticsearch bulk, Loki push, Prometheus remote write and Splunk HEC. It stores everything as Parquet or Vortex files in S3, GCS, Azure Blob, MinIO or a local disk, indexes only the fields you search, and answers SQL through Apache DataFusion and PromQL with its own evaluator over the same files. Its first 1.0 release candidate landed on 28 August 2026 and a second on 3 September; everything in this post was run on rc1. The README claims a 2 PB per day deployment and "140x lower storage cost than Elasticsearch". Both are vendor claims, so let's look at what is underneath.
Before we go inside, let's put it against the bar we set above and see how it is different:
| Most stacks today | OpenObserve | |
|---|---|---|
| Signals | Loki, Prometheus or Mimir, Tempo, one system each | Logs, metrics, traces, RUM and LLM traces in one binary, one data model, retention set per stream in one place |
| Durable tier | Each system's own storage, its own format | Object storage holds Parquet or Vortex files that DuckDB can read, so the data outlives the tool |
| Index | Elastic indexes every field, Loki indexes only labels | A full-text index only on the fields you search, kept as a small sidecar next to each data file, columnar scan for the rest |
| Query | LogQL, PromQL, TraceQL | SQL for logs and traces, PromQL for metrics |
| Shape | Several deployments to keep healthy | One process on a laptop, the same binary split into ingester, querier, compactor, router and scheduler roles on a cluster |
It is not a drop-in replacement for Prometheus, though. For metrics it takes the seat Thanos or Mimir take, long-term storage behind Prometheus with remote write in and PromQL out, and its PromQL engine has gaps that I list in the sharp edges section. Compare it with the whole LGTM stack, Elastic, or Datadog.
A log line goes in #
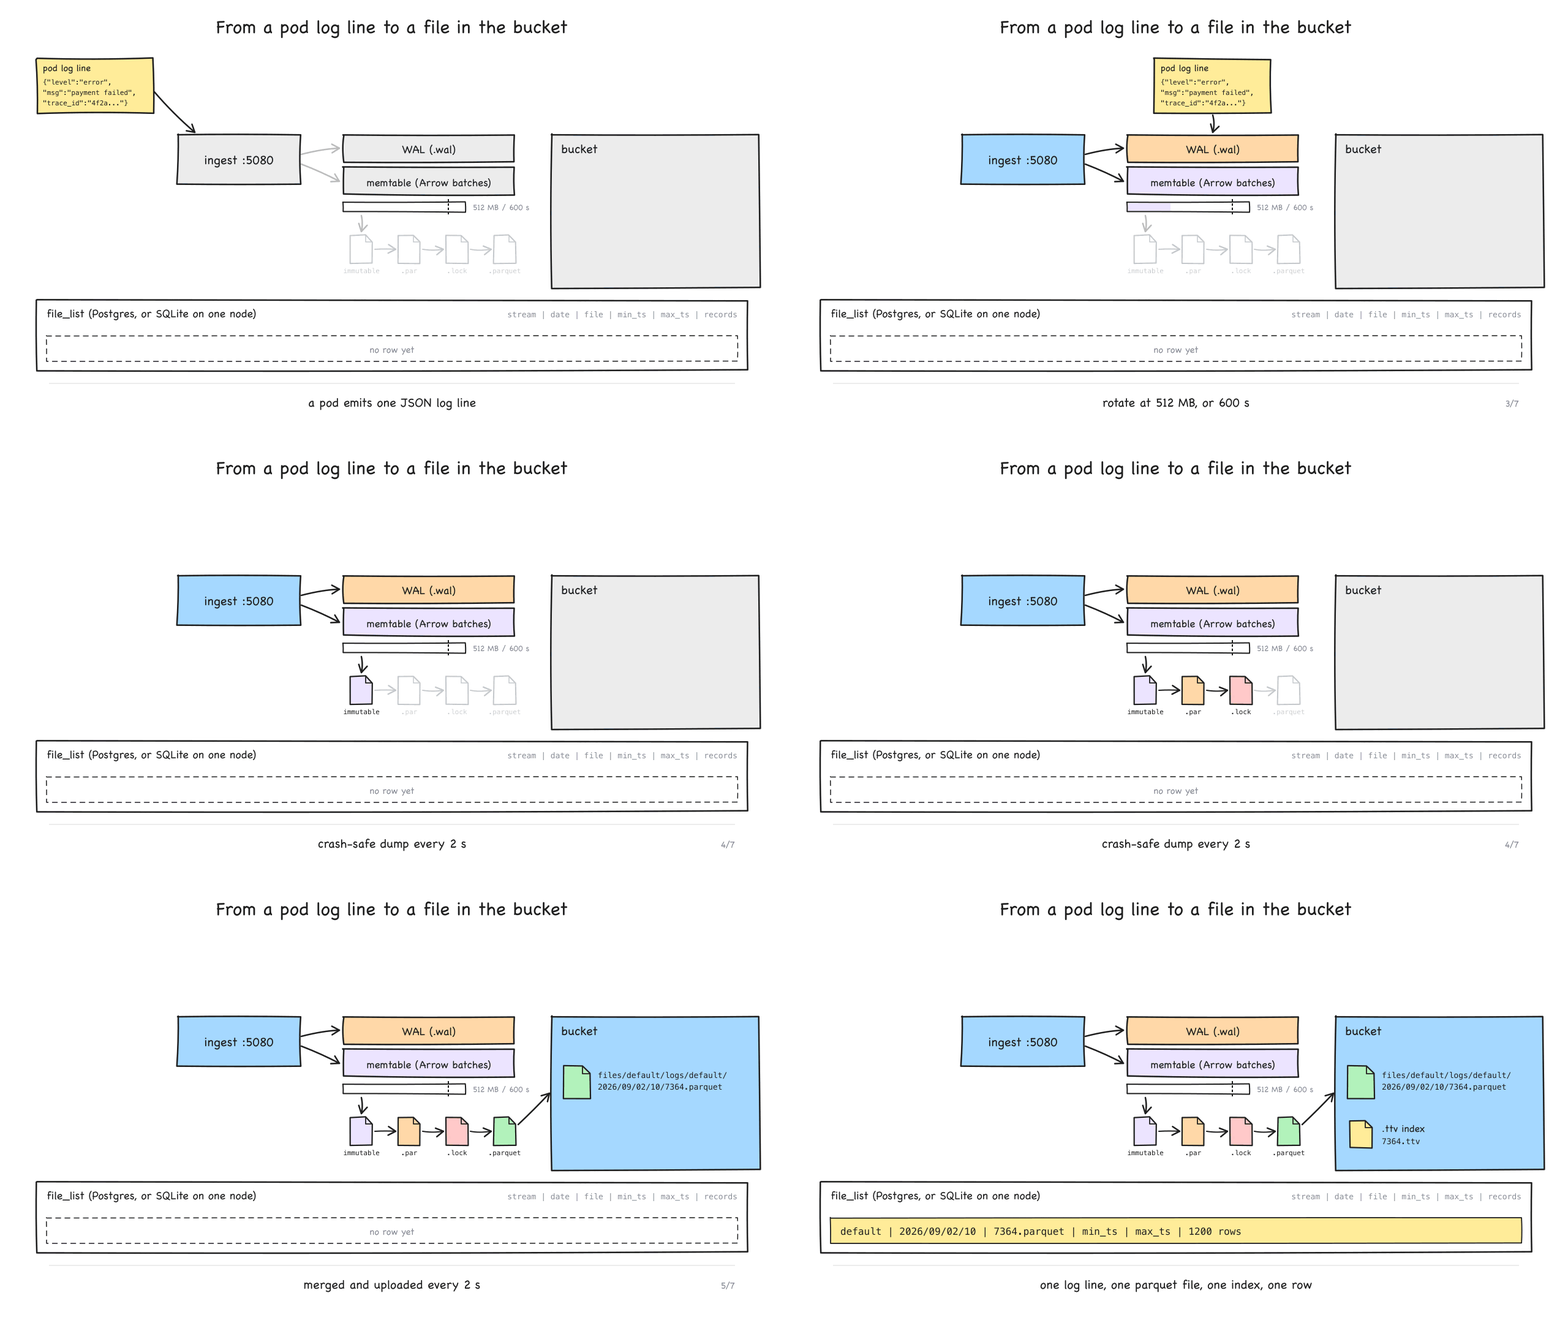
A batch lands over HTTP, its JSON is flattened (k8s.namespace.name becomes k8s_namespace_name, which is why every screenshot has those long field names) and its schema is checked against the stream. It is appended to a write-ahead log and an in-memory Arrow table at the same time. Every 2 seconds the frozen tables become Parquet, the upload job merges the dumps of the same stream, hour and schema into one file per round, writes it to the bucket under files/{org}/{type}/{stream}/YYYY/MM/DD/HH/, builds a full-text index for that file as a .ttv object, and only then records the file in the file_list catalog. If the catalog database is unreachable, nothing is uploaded, and I like that a lot: a database outage cannot litter the bucket. A failure between the upload and the catalog write can still leave an object behind, so the gate closes the common case rather than every case.
Two things you should know: the WAL is flushed but not fsynced per batch by default (ZO_WAL_FSYNC_DISABLED=true), a fair trade for a system whose durable tier is the bucket, and the defaults in the code differ from the docs in several places (the WAL rotates at 512 MB, the docs say 64), so go by the binary you run and not the docs page.
The index is a file next to the data #
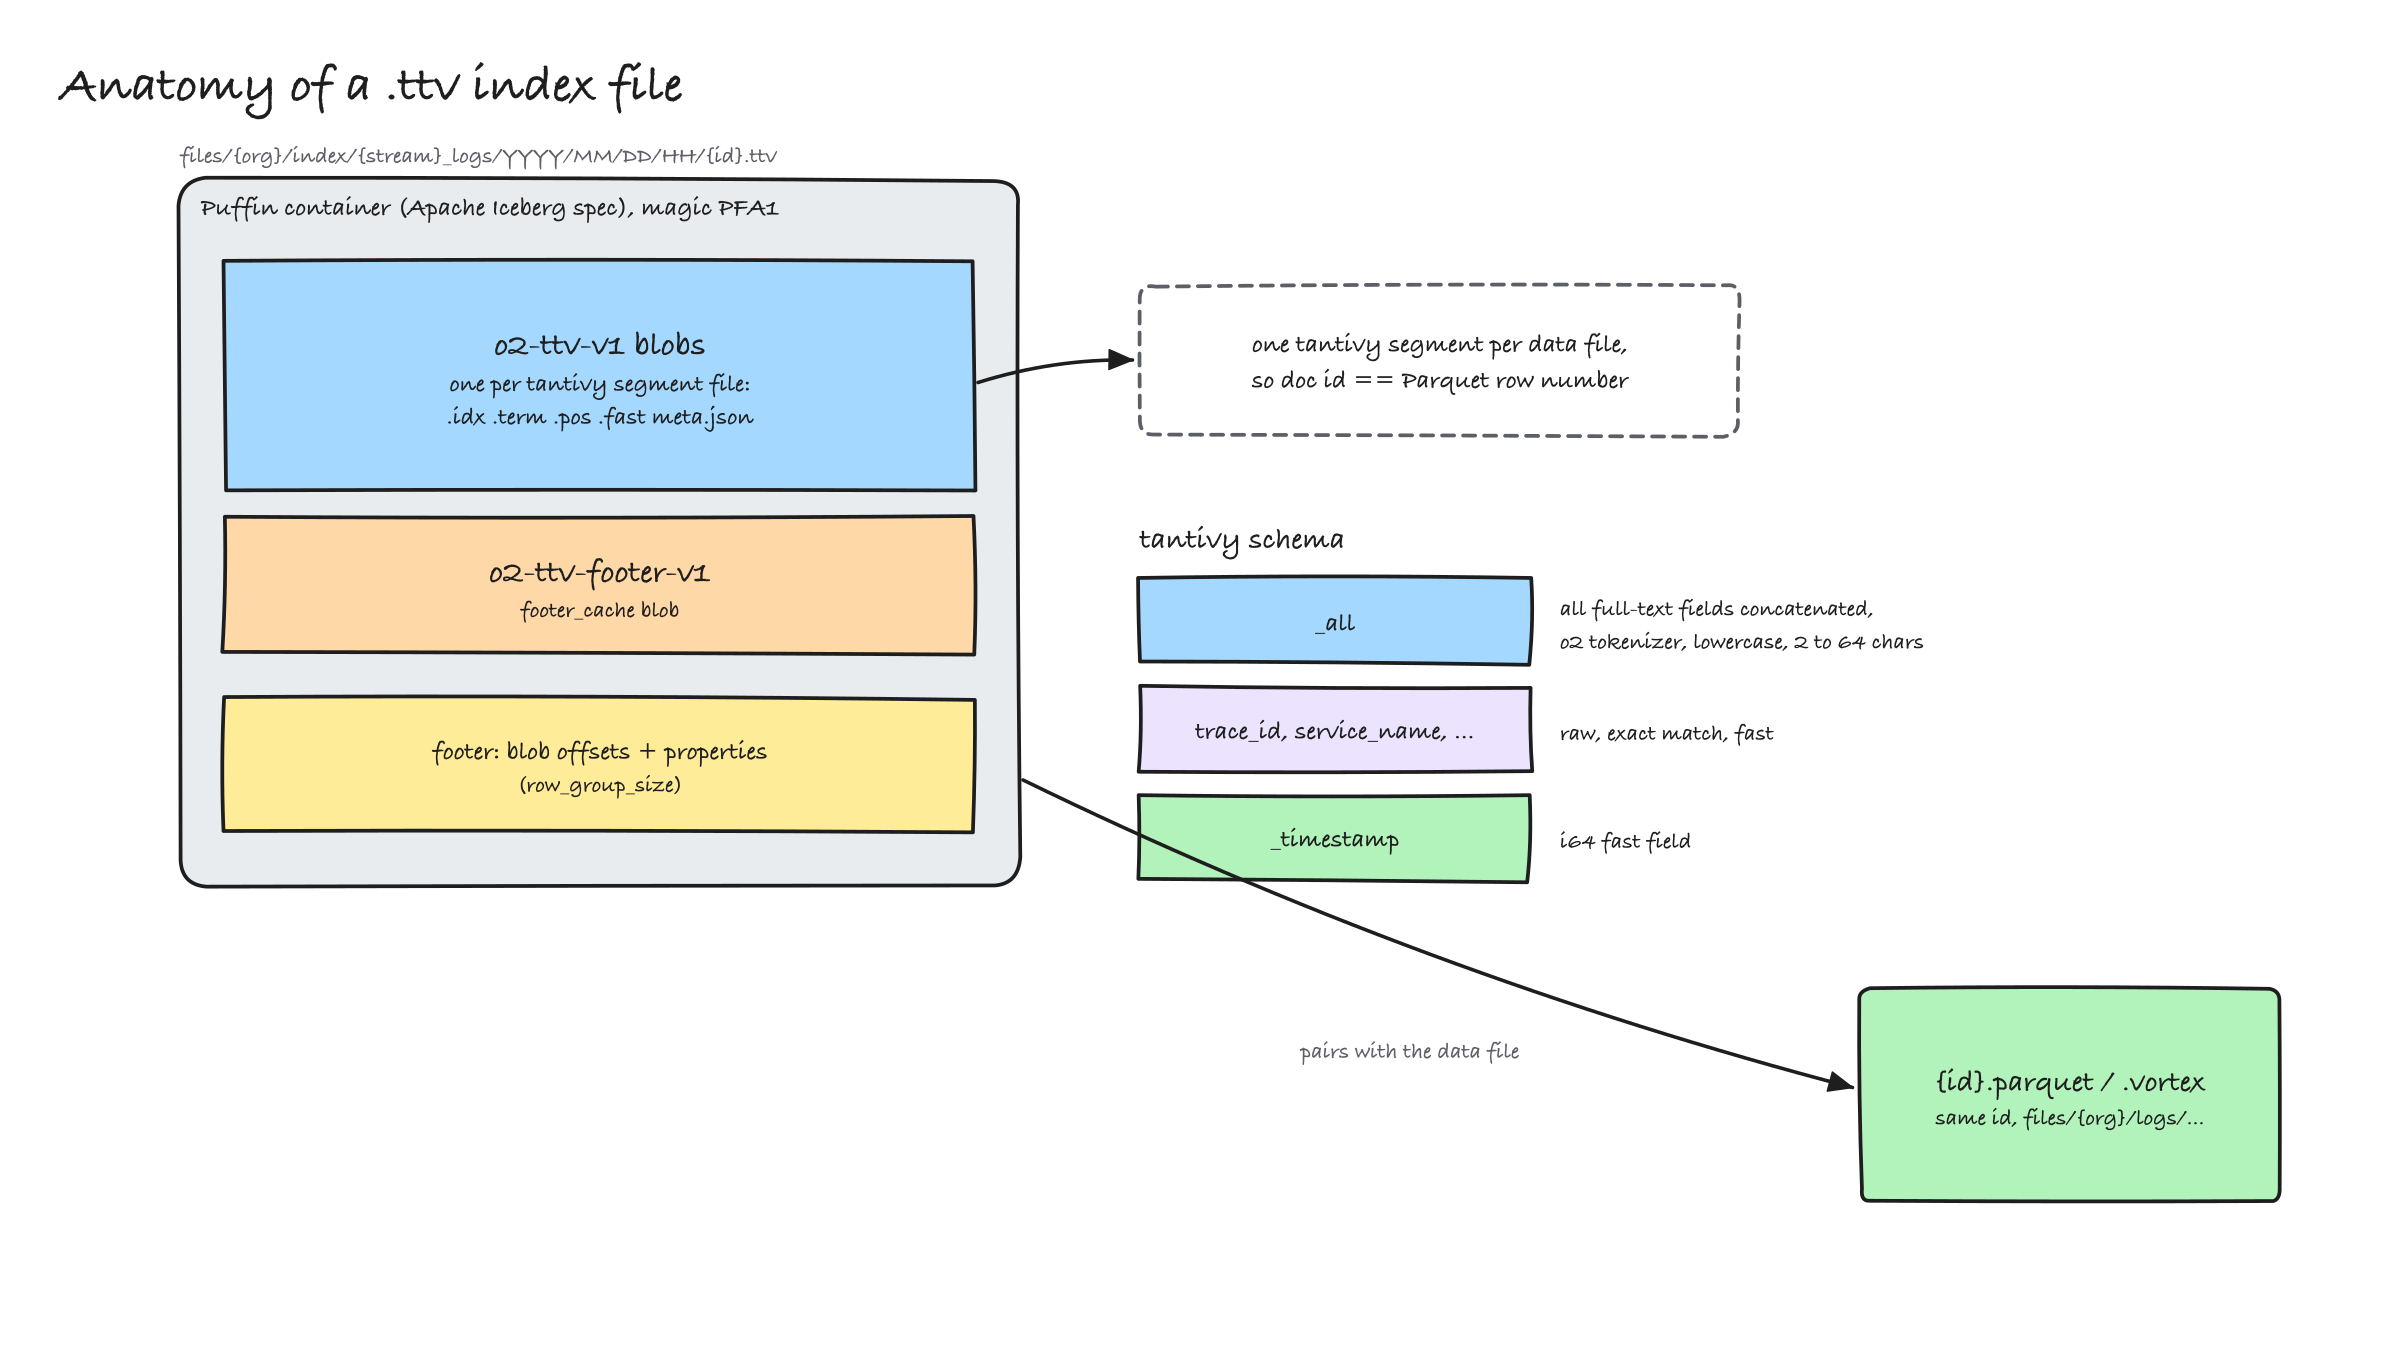
The .ttv next to each data file is an Apache Iceberg Puffin container (Puffin is Iceberg's simple format for index and statistics blobs) wrapping a single segment of tantivy, the Rust full-text search library. All configured full-text fields (message, body, log and friends) are concatenated into one indexed column, fields like trace_id are indexed whole for exact match, and _timestamp is a fast field. Because there is exactly one segment per data file, a document id in the index equals a row number in the data file. That one fact is what makes the query side cheap, as we will see next.
A query comes out #
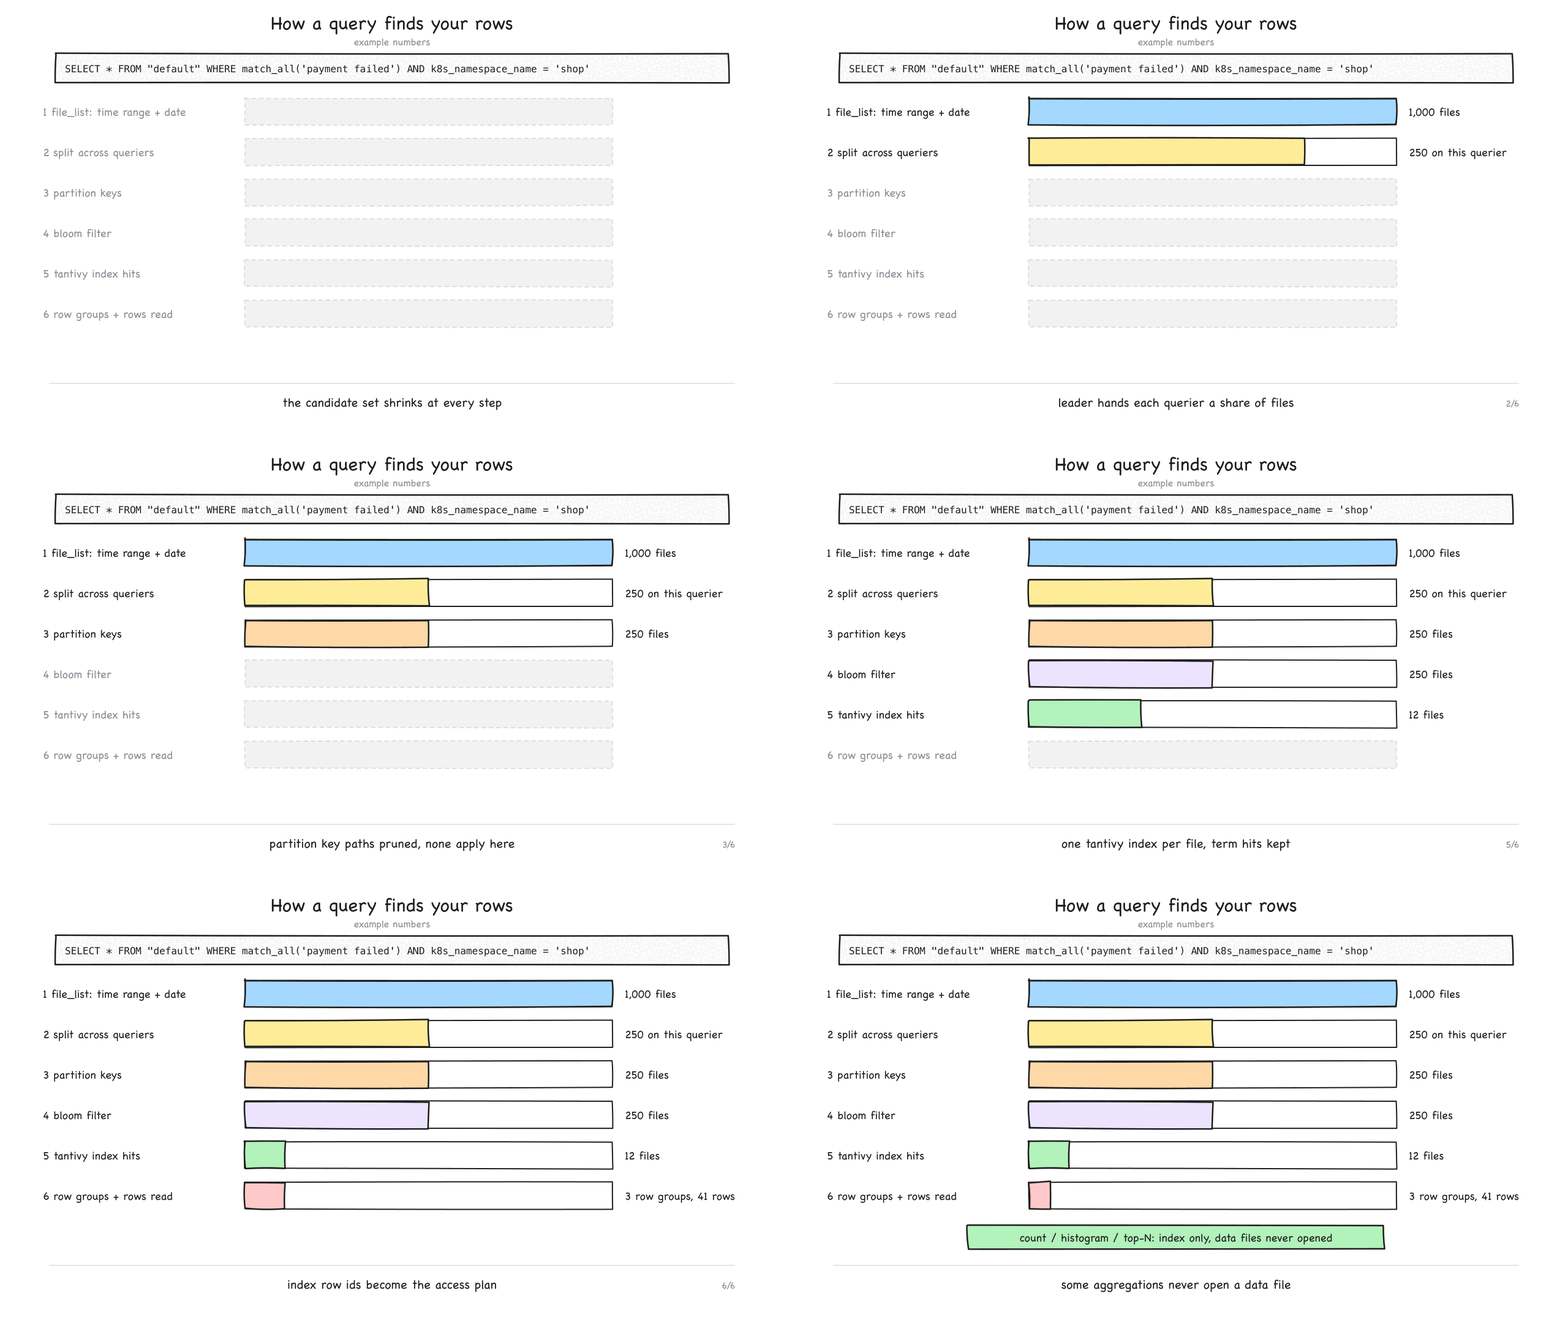
A query asks the catalog for the files that overlap the time range, splits them across queriers, and then throws away as much as it can before reading anything: files that fail the partition keys, files the bloom filters rule out, and then, using the index, everything but the matching rows. The matched row ids become a row bitmap, and the bitmap becomes a Parquet or Vortex access plan that DataFusion reads. Counts, histograms and top-N over indexed fields never open a data file at all when the file sits fully inside the query window. A background compactor merges each finished hour's small files into files of up to 2 GB and rebuilds the index, and a result cache serves repeated dashboard queries.
What 1.0 adds #
Vortex as a file format. ZO_FILE_FORMAT=parquet,logs=vortex writes logs as Vortex, a columnar format from SpiralDB that is now a Linux Foundation project, built for random access, which is exactly the shape of a "show me these 100 log lines" query. OpenObserve's own August 2026 comparison, one billion log records with everything but the format identical, vendor-run but public:
| Workload | Parquet | Vortex |
|---|---|---|
| Row fetch with LIMIT 100 (8 queries) | 1,114 ms | 436 ms |
| Indexed counts (8 queries) | 215 ms | 232 ms |
| Storage for 1 billion rows | 673.5 GB | 710.7 GB |
Faster on the query that hurts, a tie on counts, about 5 percent more disk. OpenObserve's Vortex support only left the enterprise build in July 2026 and the crate is pinned to a git revision, so I would call it new and promising, and not the default for a reason.
An MCP server that does not flood the context window. The tool catalog is generated from the OpenAPI spec, a couple of hundred tools, but tools/list returns only seven: a tool_search over the descriptions, a tools_call that returns summarised responses, and five pinned tools. Authentication is your own token, so the model inherits your permissions and nothing more. This is the part of the release I was most keen to try.
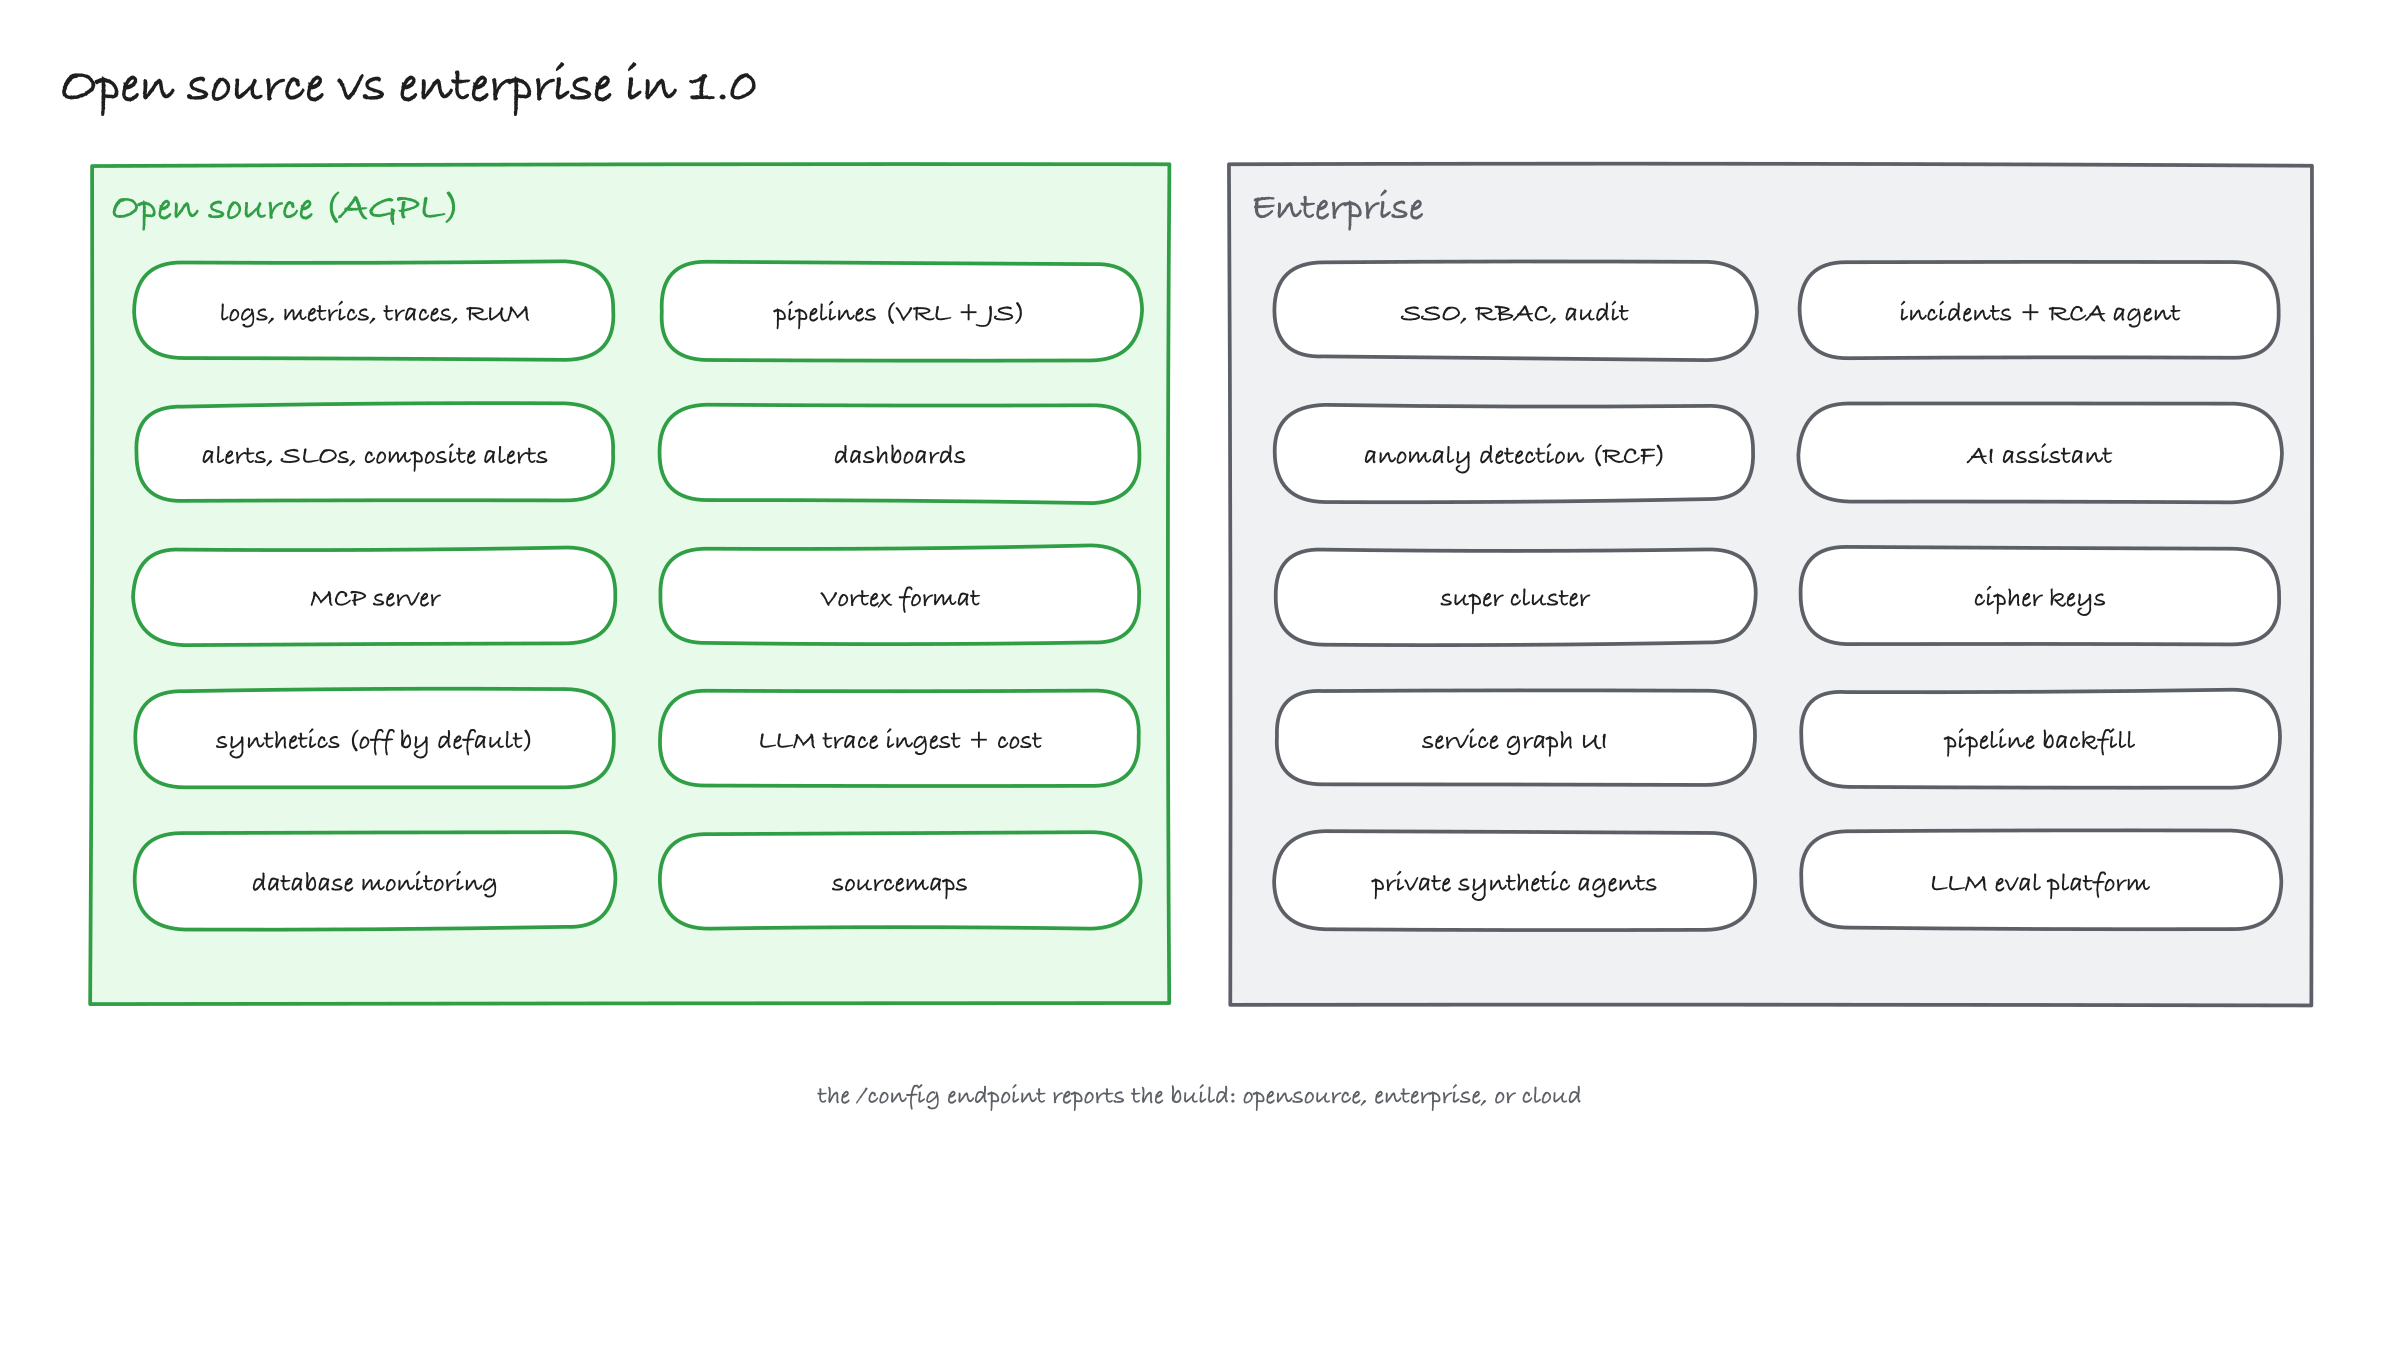
Also new, and all open source: SLOs with burn-rate alerts, a time index for traces so a bare trace id no longer scans everything, and LLM traces from the OpenTelemetry GenAI conventions plus Vercel AI SDK, OpenInference, Langfuse and TraceLoop-style attributes, priced at ingest from a built-in price table (custom pricing is enterprise). SSO and fine-grained RBAC, incidents, anomaly detection, the AI assistant and the service graph UI are enterprise.
Running it: a whole cluster into one binary #
Let's run it. I used kiac (Kubernetes in Apple Containers), where every node is its own lightweight VM on macOS. It works the same on kind or k3d. You need kubectl, helm, jq, curl and duckdb on your machine. Versions: Kubernetes v1.36.1 via kiac v0.5.1, Helm v4.1.4, DuckDB 1.4, OpenObserve v1.0.0-rc1. I ran the whole thing twice, on 2 and 4 September, and the step 8 numbers are from the second run, which I left up for 15 hours. Everything the demo uses is in one repo:
git clone https://github.com/saiyam1814/openobserve-k8s-demo
cd openobserve-k8s-demo1. Cluster and OpenObserve #
kiac create cluster --name o2 --workers 2 --memory 4G --cp-memory 4G
helm repo add openobserve https://charts.openobserve.ai
helm upgrade -i o2 openobserve/openobserve-standalone -n openobserve --create-namespace \
  -f manifests/o2-values.yaml
kubectl -n openobserve get pods,svcNAME READY STATUS RESTARTS AGE
pod/o2-openobserve-standalone-0 1/1 Running 0 58s
NAME TYPE CLUSTER-IP EXTERNAL-IP PORT(S)
service/o2-openobserve-standalone LoadBalancer 10.100.30.54 192.168.64.10 5080:30148/TCP,5081:32552/TCPThe values file pins the 1.0.0-rc1 image, asks for a LoadBalancer Service, and sets three things worth knowing:
config:
  ZO_FILE_FORMAT: "parquet,logs=vortex"        # the 1.0 feature under test
  ZO_MAX_FILE_RETENTION_TIME: "60"             # demo pacing: rotate every 60s instead of 600s
ZO_COMPACT_DELETE_FILES_DELAY_MINUTES: "10" # demo pacing: drop compacted-away files after 10 minThat EXTERNAL-IP and the chart's default root user are all the later steps need, so let's put them in two variables. Change the password the moment this is more than a demo.
export O2=http://192.168.64.10:5080          # your LoadBalancer IP will differ
export AUTH='root@example.com:Complexpass#123'Log in at $O2 with that user. The home page is empty. Let's fix that.
2. Collect everything the cluster emits #
The official collector chart installs an OpenTelemetry Collector agent as a DaemonSet and a gateway, both managed by the OpenTelemetry Operator, so cert-manager and the operator go first:
kubectl apply -f https://github.com/cert-manager/cert-manager/releases/download/v1.19.1/cert-manager.yaml
kubectl apply -f https://github.com/open-telemetry/opentelemetry-operator/releases/download/v0.158.0/opentelemetry-operator.yaml
helm upgrade -i o2c openobserve/openobserve-collector -n openobserve-collector --create-namespace \
  -f manifests/collector-values.yaml

curl -s -u $AUTH "$O2/api/default/streams?type=logs"    | jq -r '.list[].name'
curl -s -u $AUTH "$O2/api/default/streams?type=metrics" | jq '.list | length'default
k8s_events
450Container logs, Kubernetes events and 450 metric streams within a minute, from the kubelet, cAdvisor, kube-state-metrics and the API server. Later in the run the streams page summed up the storage story (the slo_slices and triggers streams come from the SLO step further down, and checkout_archive is a 40,000 row backfill I used to test compaction, not covered here):
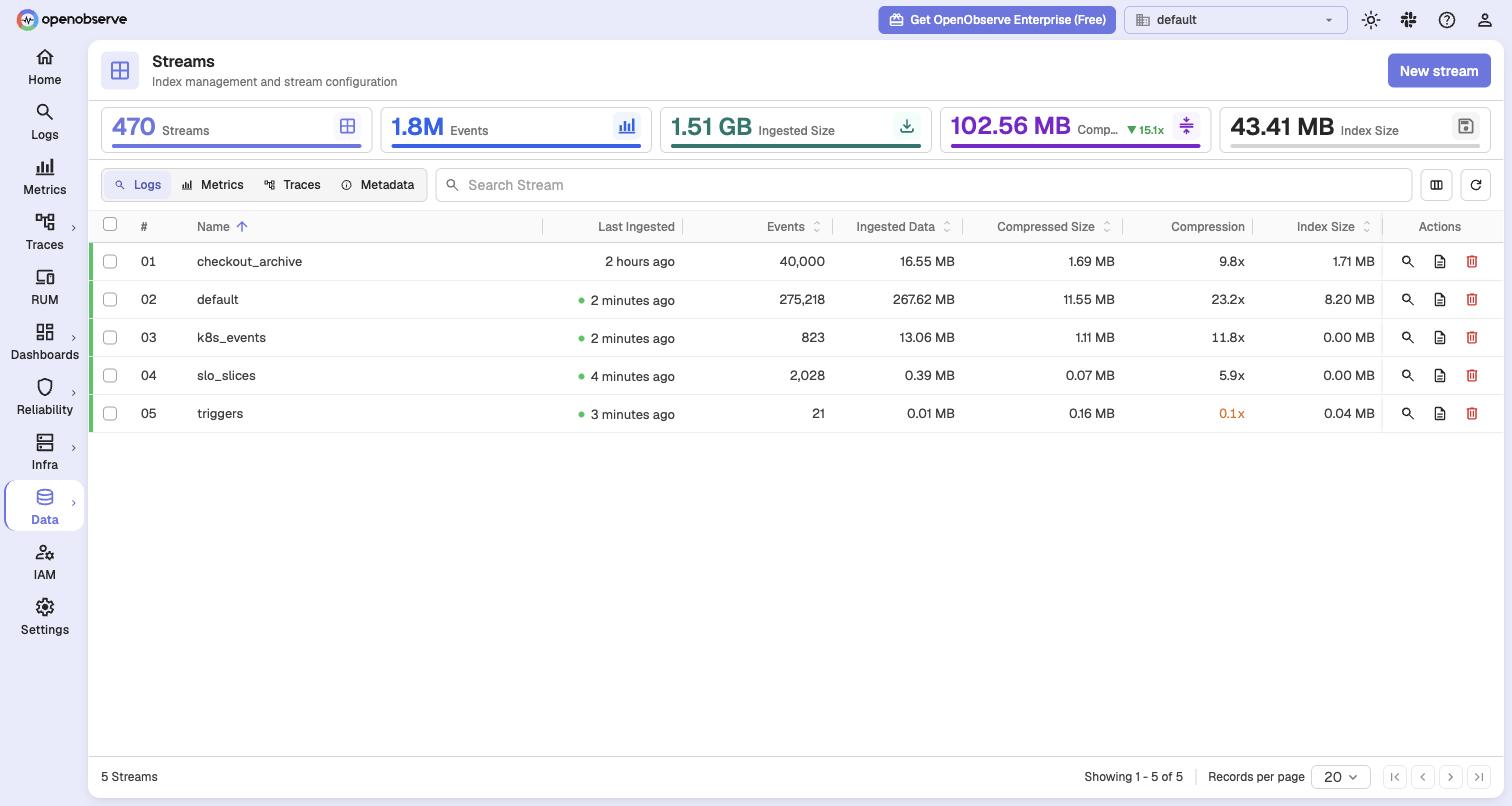
| Streams page | Whole cluster |
|---|---|
| Ingested | 1.51 GB |
| Compressed on disk | 102.56 MB (15.1x) |
| Index | 43.41 MB |
| Container logs alone | 267.62 MB in, 11.55 MB out (23.2x) |
| OpenObserve pod, all roles | 43m CPU, 597Mi memory (kubectl top pod) |
3. An application with traces and logs #
Cluster telemetry is half the picture. The other half is your own app, so I wrote a small stand-in: checkout, a Go HTTP service that takes an order, reserves inventory, charges a card and fails a configurable share of payments. It is under 200 lines in app/, instrumented with the standard OpenTelemetry Go SDK with nothing vendor-specific in the code, and it logs JSON to stdout with the trace id on every line. A load generator sends five checkouts a second.
container build -t docker.io/library/checkout:demo app     # docker build works too
kiac load image docker.io/library/checkout:demo --name o2       # kind load docker-image on kind
kubectl apply -f manifests/10-shop.yaml
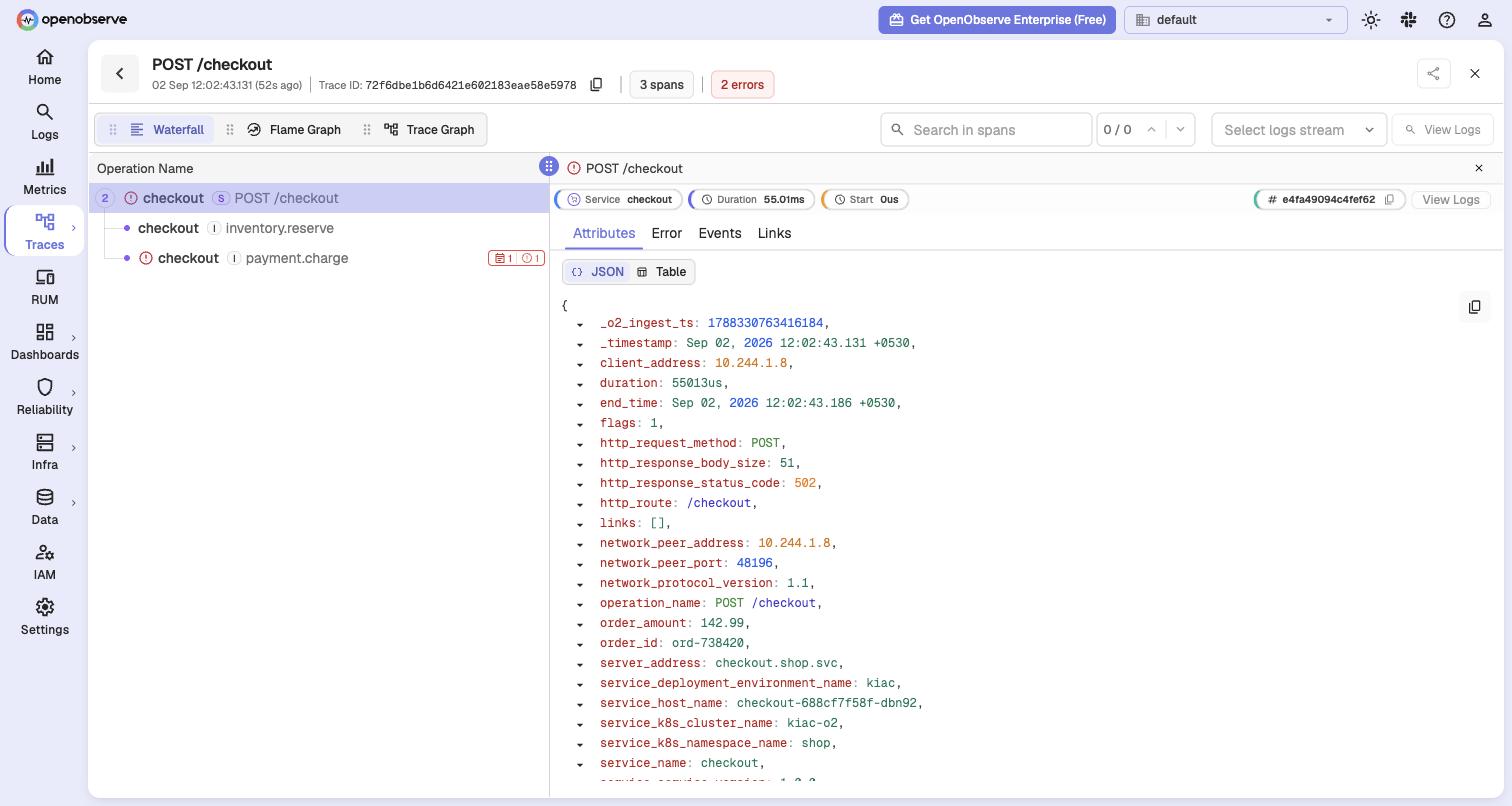
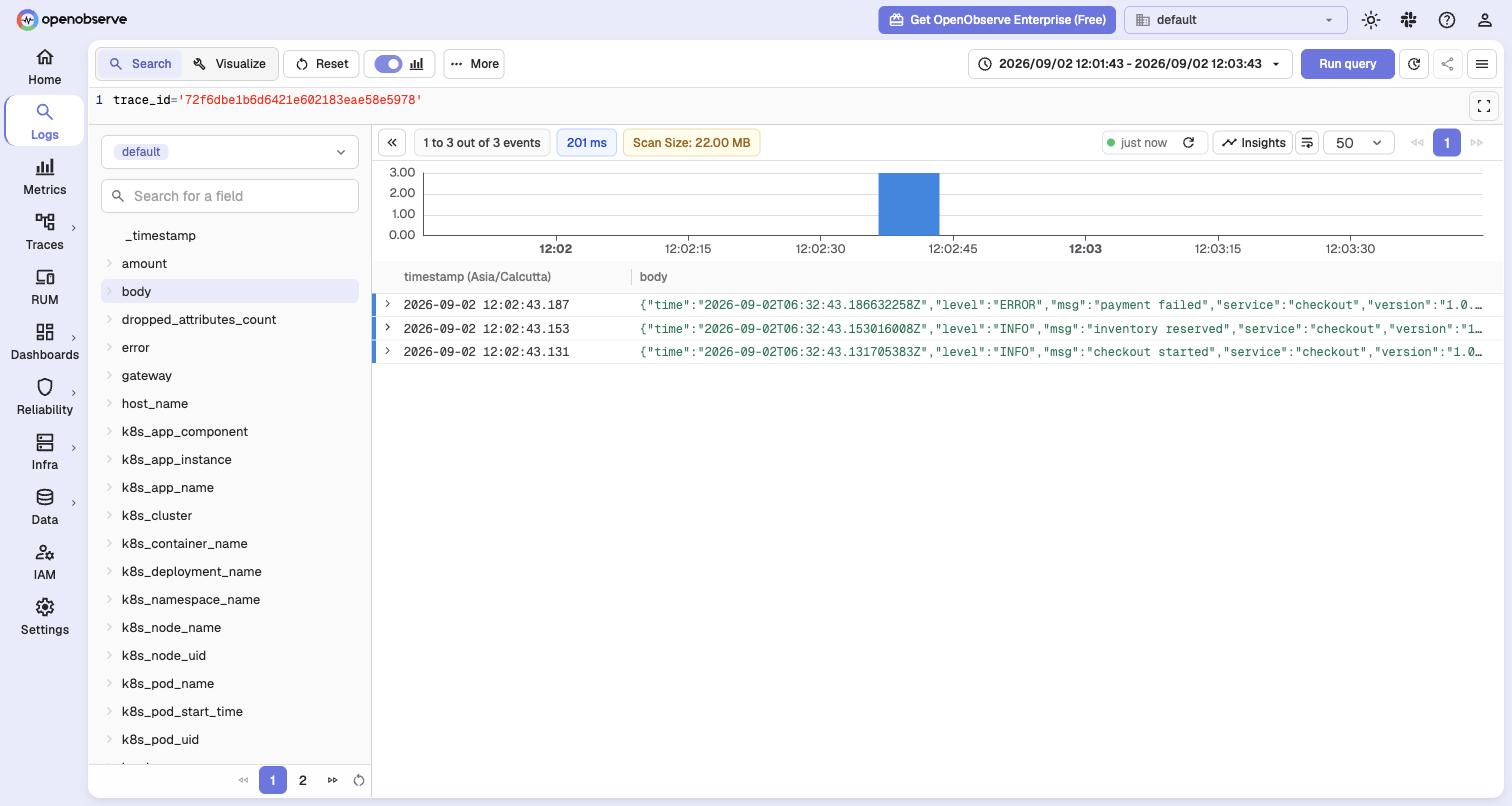
kubectl -n shop logs deploy/checkout --tail=1{"time":"2026-09-04T05:53:06.35924046Z","level":"ERROR","msg":"payment failed","service":"checkout","version":"1.0.0","order_id":"ord-846683","amount":64.99,"gateway":"stripe-sandbox","error":"payment gateway timeout","trace_id":"a309a2bc90a055def047fb770fc2d00e","span_id":"40f0e133e5d9c8cc"}In the UI, traces arrived immediately, three spans per request. From a trace, "View Logs" opens the logs page filtered on that trace id, and the three log lines of that request are right there, including the failed payment.
4. Parse the log body at ingest #
That link needs trace_id to be a column, and the collector delivers each log line as one body string. Rather than reconfigure the collector, a realtime pipeline parses it at ingest: source stream default, a VRL function (Vector Remap Language, the transform language from Vector), destination stream default. Both objects are JSON files you POST:
curl -s -u $AUTH -H 'Content-Type: application/json' -X POST "$O2/api/default/functions" \
  -d @manifests/function-parse-checkout-json.json
curl -s -u $AUTH -H 'Content-Type: application/json' -X POST "$O2/api/default/pipelines" \
-d @manifests/pipeline-parse-shop-logs.json{"code":200,"message":"Function saved successfully"}
{"code":200,"message":"Pipeline created successfully","id":"7500791427660513280","name":"parse-shop-logs"}The function is the interesting part (abridged here, the version in the repo also copies span_id, order_id, amount, gateway, error and sku):
if .k8s_namespace_name == "shop" && exists(.body) {
  parsed, err = parse_json(string!(.body))
  if err == null && is_object(parsed) {
    .level = downcase(string!(parsed.level))
    .msg = parsed.msg
    .trace_id = parsed.trace_id
  }
}
.A minute later the new fields are columns, and a search over the API shows the join key sitting right there:
curl -s -u $AUTH -H 'Content-Type: application/json' "$O2/api/default/_search?type=logs" -d '{"query":{
  "sql":"SELECT level, msg, order_id, trace_id FROM \"default\" WHERE k8s_namespace_name='"'"'shop'"'"' AND level='"'"'error'"'"' ORDER BY _timestamp DESC",
"start_time":'$(( $(date +%s) - 600 ))000000',"end_time":'$(date +%s)000000',"size":2}}' | jq -c '.hits[] | del(._timestamp)'{"level":"error","msg":"payment failed","order_id":"ord-648398","trace_id":"e826c2d59bc16d05923d1d654bafcd4c"}
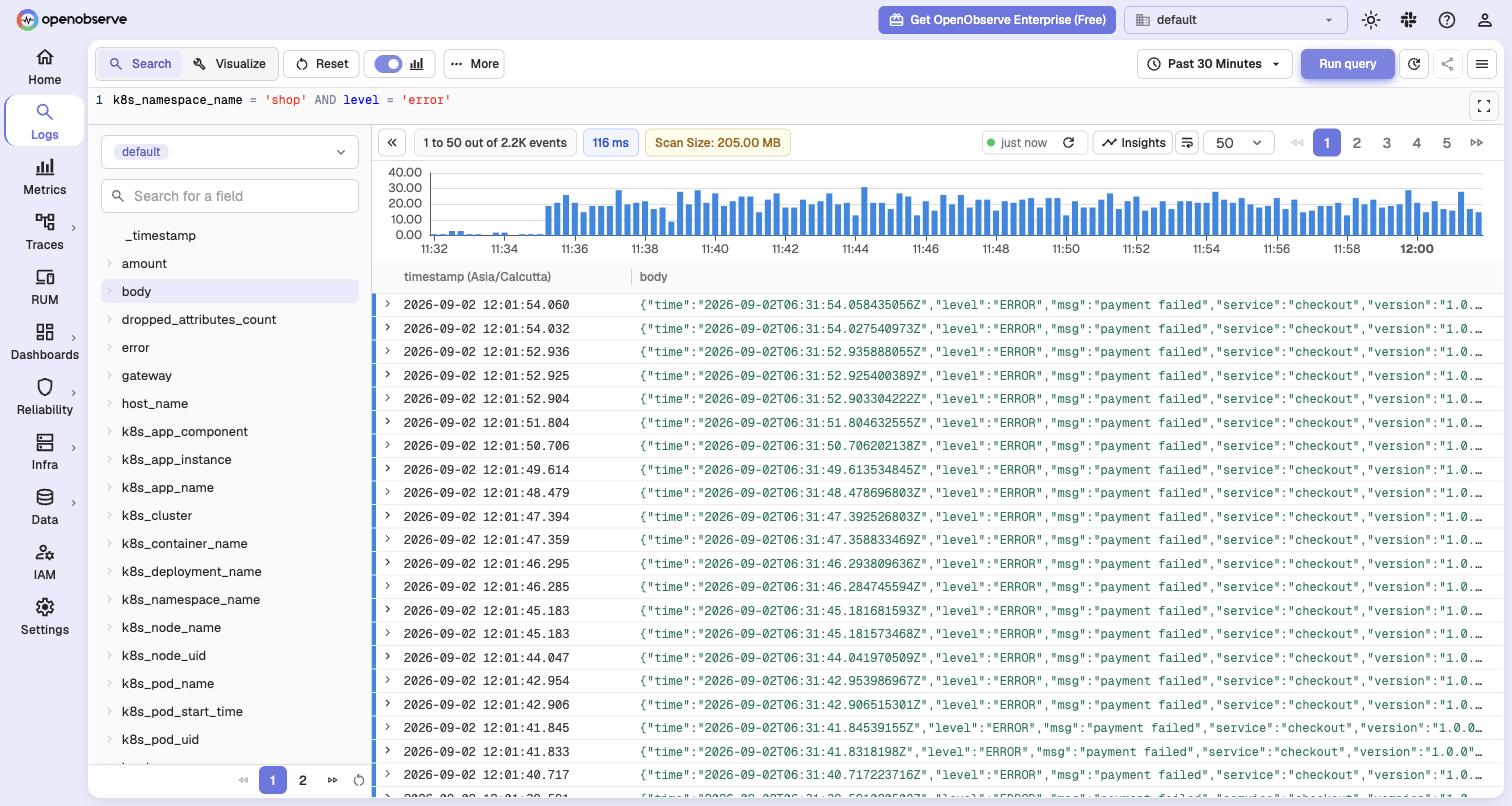
{"level":"error","msg":"payment failed","order_id":"ord-311027","trace_id":"512dea2672432a9e4b827d48af5e1e1b"}In the UI the same fields show up as facets on the left, which is what turns "grep the shop namespace" into clicking k8s_namespace_name, then level. This is 2.2K error rows in 116 ms:
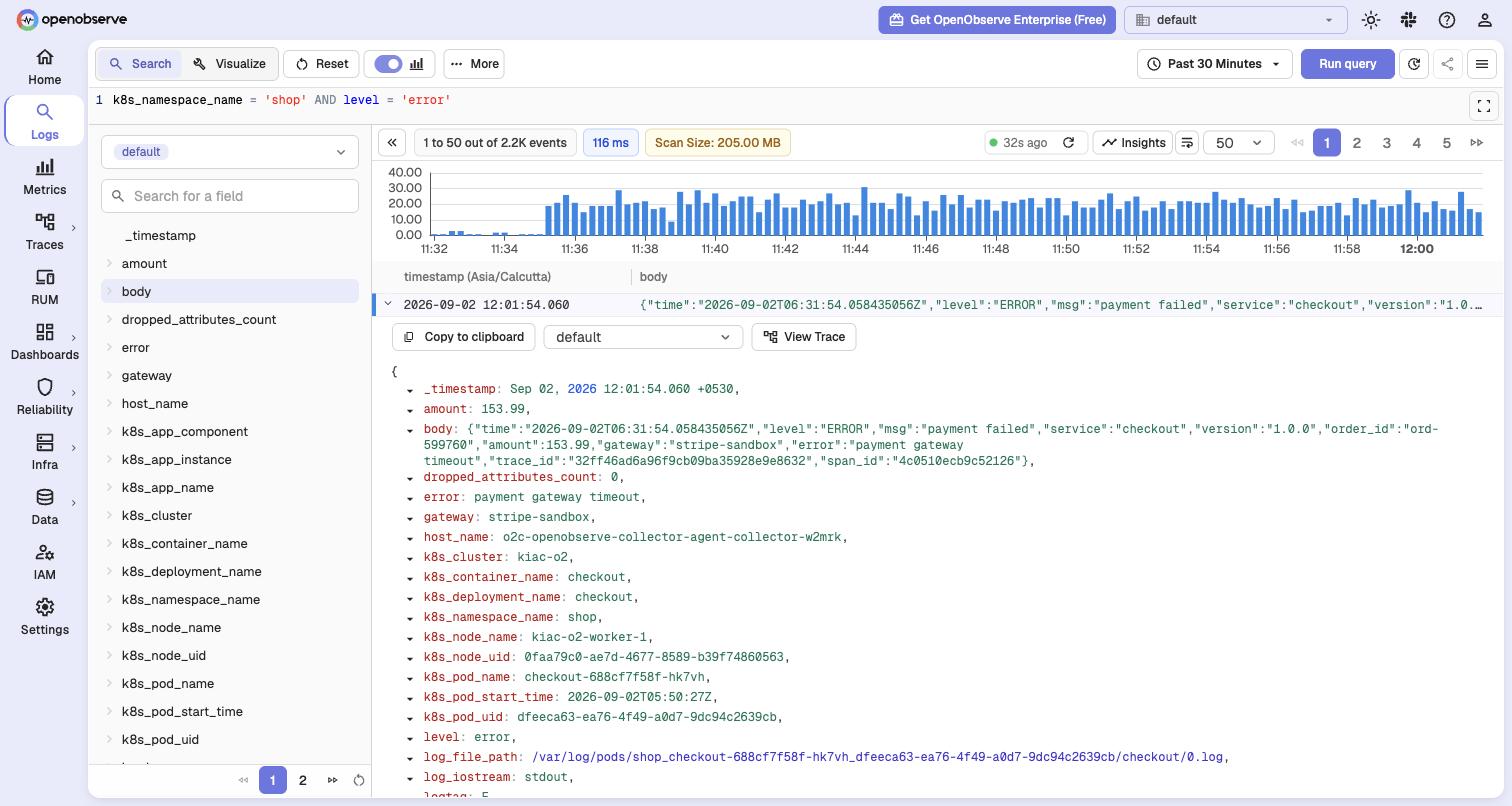
And the jump works in both directions. Expand any of those rows and there is a View Trace button on it, because the trace id is now a field:
5. Look at the files #
Now for my favourite part: the write path from earlier, in a real data directory. The image has no shell, so an ephemeral debug container that shares the process namespace gets you the filesystem through /proc/1/root:
kubectl -n openobserve debug o2-openobserve-standalone-0 --image=busybox:1.36 \
  --target=openobserve-standalone --container=toolbox --profile=general -- sleep 86400
kubectl -n openobserve exec o2-openobserve-standalone-0 -c toolbox -- sh -c \
'cd /proc/1/root/data/stream && find files/default -type f | sed "s/.*\.//" | sort | uniq -c' 3989 parquet <- metrics
3674 ttv <- one index per data file
19 vortex <- logs, in Vortex, written by the ingesterThese are binary columnar files, so cat shows nothing useful. What identifies them is the first four bytes. Copy one file of each type out of the pod (the loop picks whatever file find sees first, so your names will differ) and look at those bytes:
for ext in parquet ttv vortex; do
  F=$(kubectl -n openobserve exec o2-openobserve-standalone-0 -c toolbox -- sh -c \
    "cd /proc/1/root/data/stream && find files/default -name '*.$ext' 2>/dev/null | head -1")
  kubectl -n openobserve exec o2-openobserve-standalone-0 -c toolbox -- cat "/proc/1/root/data/stream/$F" > sample.$ext
done
for f in sample.parquet sample.ttv sample.vortex; do printf '%-16s ' "$f"; head -c 4 "$f" | xxd | cut -c10-; donesample.parquet 5041 5231 PAR1
sample.ttv 5046 4131 PFA1
sample.vortex 5654 5846 VTXFParquet, a Puffin index container, Vortex. To look inside an index, OpenObserve ships ttv-inspect. The image has no shell, so it runs as a Job on the same volume (manifests/20-ttv-inspect-job.yaml). The Job needs two things filled in: the node that holds the volume, because a local-path volume only exists on one node, and the index file to read. Both come from kubectl:
NODE=$(kubectl -n openobserve get pod o2-openobserve-standalone-0 -o jsonpath='{.spec.nodeName}')
TTV=$(kubectl -n openobserve exec o2-openobserve-standalone-0 -c toolbox -- sh -c \
  "cd /proc/1/root/data/stream && find files/default/index/default_logs -name '*.ttv' 2>/dev/null | head -1")
kubectl -n openobserve delete job ttv-inspect --ignore-not-found   # a Job's template is immutable, so re-runs need this
sed -e "s#NODE_NAME#$NODE#" -e "s#TTV_PATH#/data/stream/$TTV#" manifests/20-ttv-inspect-job.yaml | kubectl apply -f -
kubectl -n openobserve wait --for=condition=complete job/ttv-inspect --timeout=180s
kubectl -n openobserve logs job/ttv-inspectblob_count : 6
row_group_size : 131072
segments : 1
total_docs : 248318 (deleted: 0)
_all text [indexed, tokenizer=o2]
service_name text [indexed,fast, tokenizer=raw]
trace_id text [indexed,fast, tokenizer=raw]
_timestamp i64 [fast]One segment, 248,318 documents, which is exactly the row count DuckDB reports for the Vortex file of the same hour below, and the fields _all, service_name and trace_id. Then the test that matters for bar item 3: can another tool read these files? OpenObserve does not ship or use DuckDB. I picked it because it is a single binary that reads Parquet natively and has a Vortex extension.
brew install duckdb
duckdb -c "INSTALL vortex; LOAD vortex;
  SELECT k8s_namespace_name AS namespace, count(*) AS rows FROM read_vortex('sample.vortex')
GROUP BY 1 ORDER BY rows DESC LIMIT 5;"| namespace | rows |
|---|---|
| openobserve | 178847 |
| shop | 61987 |
| kube-system | 6431 |
| NULL | 781 |
| cert-manager | 187 |
That is one hour of container logs for the whole cluster, 248,318 rows, read straight out of the file OpenObserve wrote. Your counts will differ, but the point is that the query works at all. If the tool disappeared tomorrow, your data would still be in a bucket, in a format other tools can read.
6. Ask it questions over MCP #
The MCP endpoint speaks streamable HTTP, so a curl loop is a client. mcp.sh in the repo wraps one JSON-RPC call and reads the O2 and AUTH variables we exported in step 1, so if you are in a new terminal, export them again first:
./mcp.sh tools/list | jq -r '.result.tools[].name'
./mcp.sh tools/call '{"name":"tool_search","arguments":{"query":"list traces with errors","limit":1}}' \
  | jq -r '.result.content[0].text | fromjson | .tools[0].name'
./mcp.sh tools/call '{"name":"tools_call","arguments":{"tool":"SearchSQL","detail":"summary","args":{"org_id":"default","type":"traces",
  "request_body":{"query":{"sql":"SELECT service_name, operation_name, count(*) AS errors FROM \"default\" WHERE span_status='"'"'ERROR'"'"' GROUP BY service_name, operation_name","start_time":'$(( $(date +%s) - 3600 ))000000',"end_time":'$(date +%s)000000',"size":10}}}}}' \
| jq -c '.result.structuredContent.hits'tool_search
tools_call
GetLatestTraces
PrometheusRangeQuery
SearchSQL
StreamList
StreamSchema
GetLatestTraces
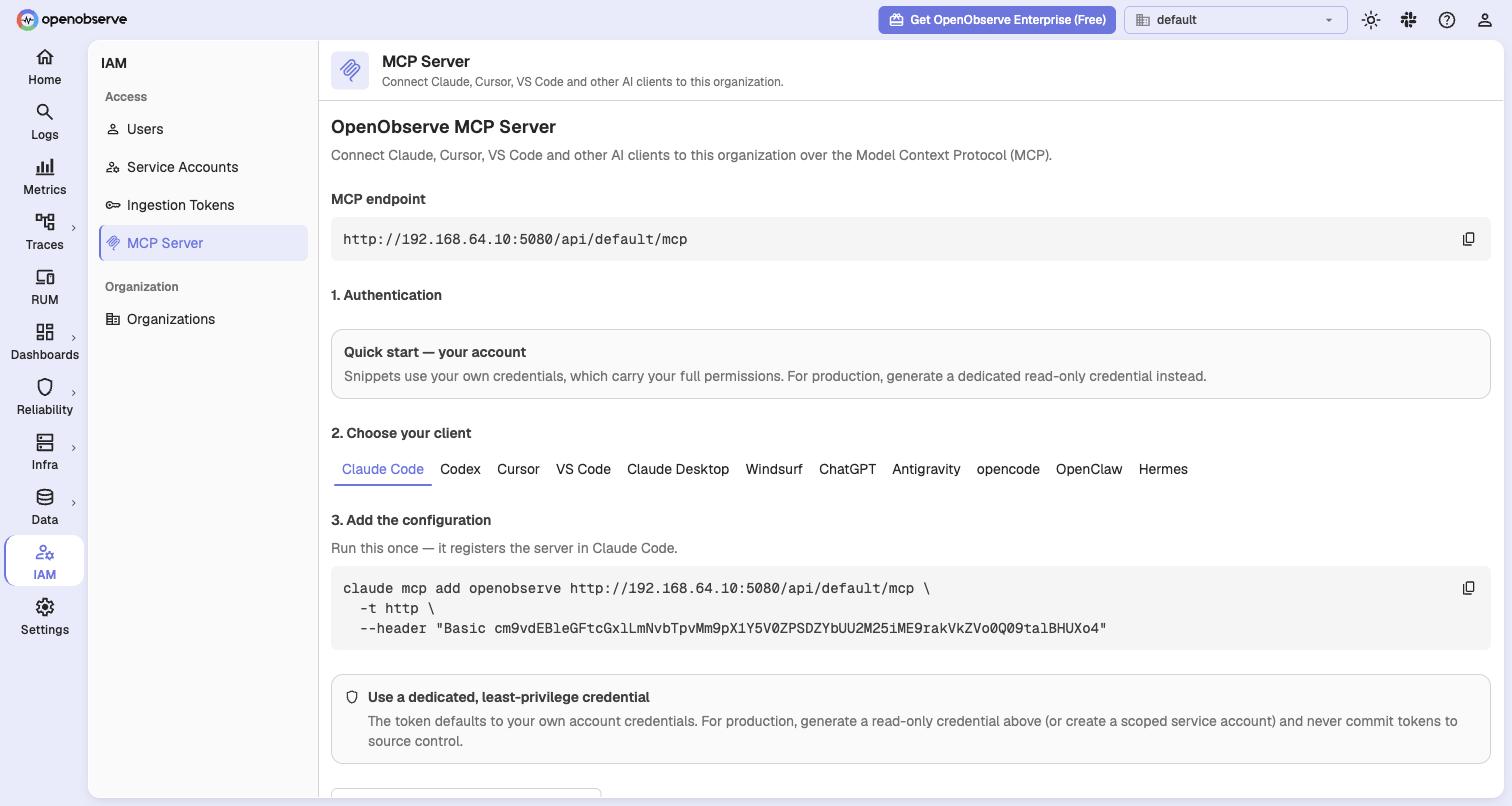
[{"service_name":"checkout","operation_name":"POST /checkout","errors":31},{"service_name":"checkout","operation_name":"payment.charge","errors":31}]That is the whole surface an agent sees: seven tools, a search that finds the right one by intent, and a summarised answer. To wire this into Claude Code, Cursor or VS Code, the setup page under IAM writes the exact claude mcp add command for you, and nudges you toward a read-only credential, which is good advice:
7. Break an SLO #
Define an SLO on the checkout traces (a good event is a POST /checkout span that did not end in ERROR, target 99 percent over 7 days), deploy a webhook echo server to receive alerts, and create the alert objects. An alert in OpenObserve is three things: a template (the payload body), a destination (where it goes) and the alert itself, so that is three POSTs, all from manifests/alert-burn-rate.json. A second, plain scheduled alert on error spans goes in alongside it, you will see why in a moment. Then push the failure rate to 60 percent:
kubectl apply -f manifests/30-alert-sink.yaml
curl -s -u $AUTH -H 'Content-Type: application/json' -X POST "$O2/api/default/slos" \
  -d @manifests/slo-checkout-availability.json
SLO=$(curl -s -u $AUTH "$O2/api/default/slos" | jq -r '.list[0].id')
jq '.template'    manifests/alert-burn-rate.json | curl -s -u $AUTH -H 'Content-Type: application/json' -X POST "$O2/api/default/alerts/templates" -d @-
jq '.destination' manifests/alert-burn-rate.json | curl -s -u $AUTH -H 'Content-Type: application/json' -X POST "$O2/api/default/alerts/destinations" -d @-
jq --arg id "$SLO" '.alert | .query_condition.slo_condition.slo_id = $id' manifests/alert-burn-rate.json \
  | curl -s -u $AUTH -H 'Content-Type: application/json' -X POST "$O2/api/v2/default/alerts" -d @-
curl -s -u $AUTH -H 'Content-Type: application/json' -X POST "$O2/api/v2/default/alerts" -d @manifests/alert-error-spans.json
kubectl -n shop exec deploy/loadgen -- curl -s "http://checkout.shop.svc/chaos?rate=60"{"code":200,"message":"SLO saved","id":"7500794280517042176","name":"checkout-availability"}
{"code":200,"message":"Template saved","id":"3IlAageUwczuTkc0FuyqEEP1dd4","name":"burn-rate-json"}
{"code":200,"message":"Destination saved","id":"3IlB8cmyOkm43oPUBBduELWjUlI","name":"alert-sink"}
{"code":200,"message":"Alert saved","id":"3IlBHI5FXraQCVx9pCYEJRwOBuX","name":"checkout-burn-rate"}
{"code":200,"message":"Alert saved","id":"3IlEZgA5TSGAwDC0Rl3spdfsGut","name":"checkout-error-spans"}
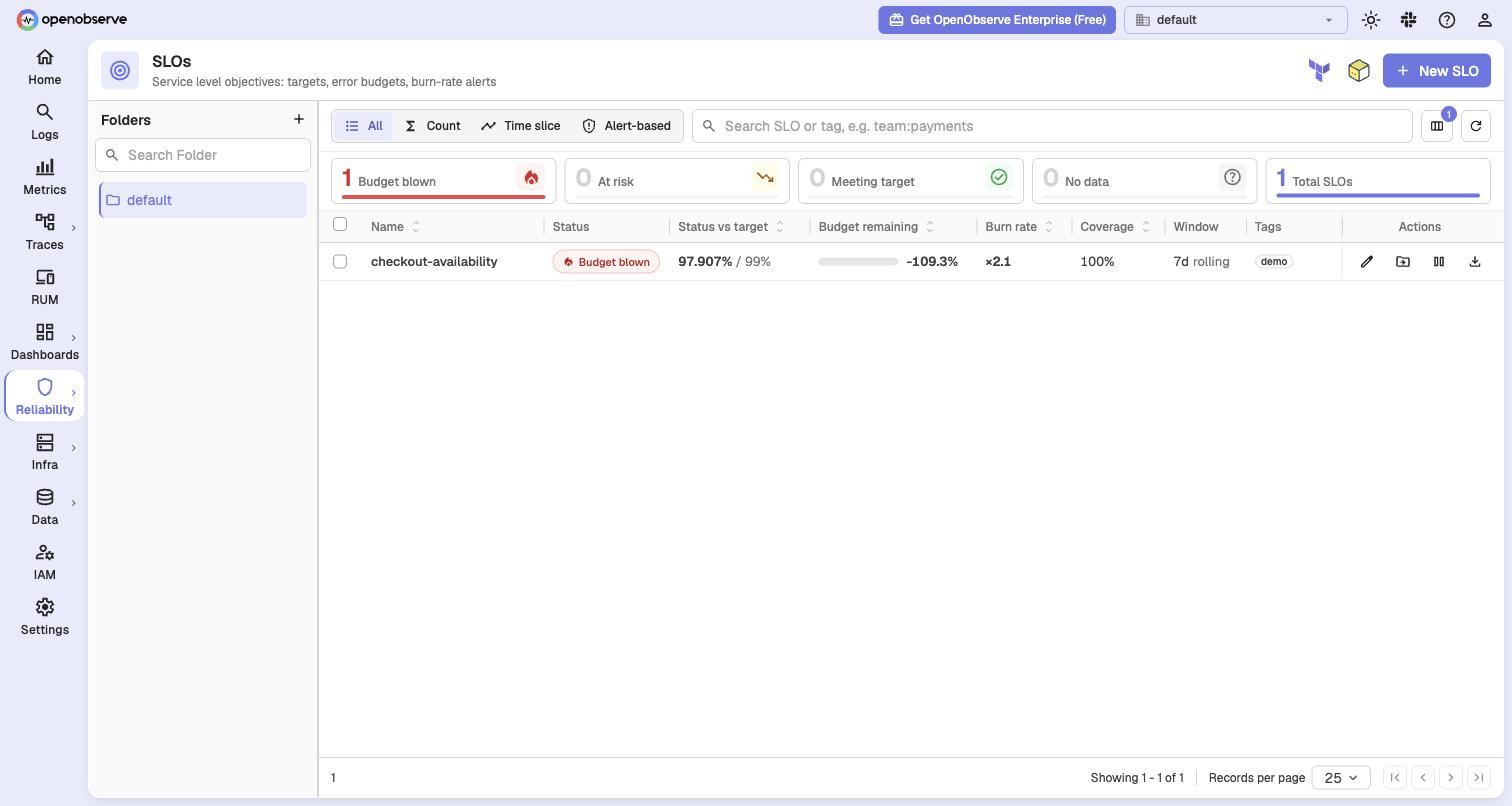
{"fail_rate_percent":60}One catch you will hit: the echo server has a private cluster IP and OpenObserve blocks those as webhook destinations (SSRF protection, so a webhook cannot be pointed at internal services), so the values file sets ZO_SKIP_SSRF_CHECKS=true. Fine for a demo, wrong for anything internet-facing. Within a minute the SLO page showed 97.907 percent against 99 and "Budget blown":
The burn-rate alert stayed quiet, and its evaluations were logged as "frozen (unobserved)". That freeze is deliberate: an SLO alert never fires or resolves while its windows are unmeasured. But the measurements were being written, and the status row the alert reads was written once at creation and never advanced afterwards. Debug logging gave the reason in one line:
kubectl -n openobserve logs o2-openobserve-standalone-0 | grep "\[slo\] pass failed"ERROR [slo] pass failed for 7500794280517042176 org=default: DbError# SeaORMError# Execution Error:
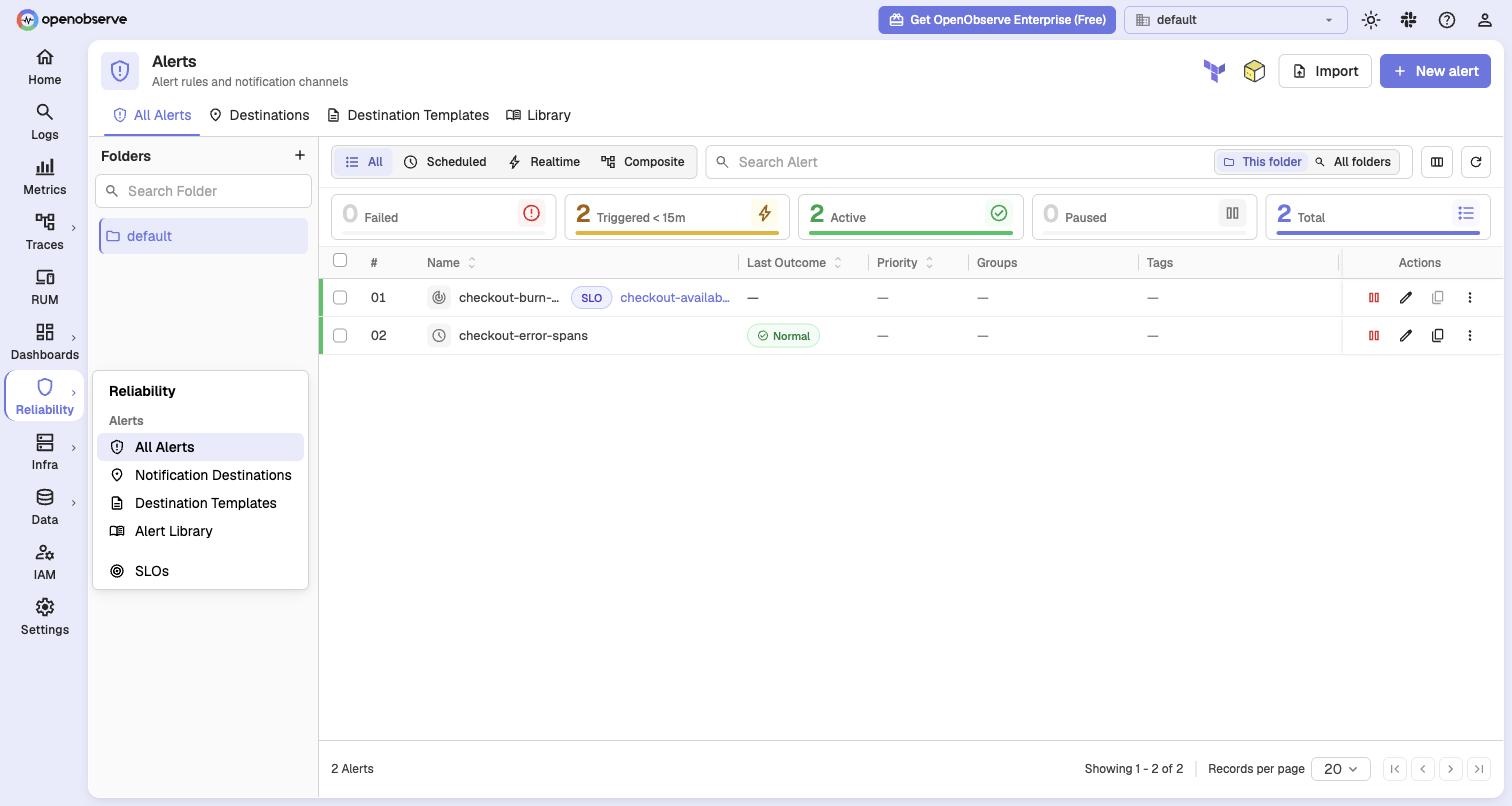
error returned from database: (code: 8) attempt to write a readonly databaseThe SLO pass opens the read-only database client and then writes through it. On PostgreSQL the read-only pool falls back to the normal connection unless you point it at a replica, so most cluster deployments are fine. On SQLite, which every single-node install uses, the write fails, so SLO alerts stay frozen in local mode on this release candidate, and rc2 has the same line. It is a one-line fix. Plain alerts are unaffected, which is why we created the second one. The scheduled alert on the same failed spans evaluates once at creation, where it usually reports Normal, and fires on the next run a minute later, so give it that minute before reading the echo server:
kubectl -n shop logs deploy/alert-sink | jq -R -c 'fromjson? | select(.path=="/alerts") | .body | fromjson'{"alert":"checkout-error-spans","stream":"traces/default","org":"default","type":"scheduled","level":"critical","fired_at":"2026-09-02T06:34:44","url":"/web/short/f0a29971a7f5701d?org_identifier=default"}The alerts page tells the same story in one row each: the SLO-backed alert with no outcome yet, the scheduled one showing its last result.
Heal the app with chaos?rate=2 when you are done.
8. Compaction, the bill, and how fast it answers #
Every hour the ingester leaves behind a pile of small files, and once the hour closes the compactor merges them, rebuilds the index and writes a bloom filter sidecar. You can see both states on disk at once, the open hour and the one before it:
kubectl -n openobserve exec o2-openobserve-standalone-0 -c toolbox -- sh -c '
  cd /proc/1/root/data/stream
  PREV=$(date -u -d @$(( $(date +%s) - 3600 )) +%Y/%m/%d/%H); CUR=$(date -u +%Y/%m/%d/%H)
  echo "closed hour $PREV (KB, file)"
  du -ak files/default/logs/default/$PREV files/default/index/default_logs/$PREV files/default/bloom/default_logs/$PREV | grep "\."
echo "current hour $CUR: $(ls files/default/logs/default/$CUR | wc -l) files"'closed hour 2026/09/04/04 (KB, file)
14924 files/default/logs/default/2026/09/04/04/75015051248633118722d6f.vortex
11228 files/default/index/default_logs/2026/09/04/04/75015051248633118722d6f.ttv
516 files/default/bloom/default_logs/2026/09/04/04/1788498194507969.bf
current hour 2026/09/04/05: 13 filesThirteen small files in the open hour, one 15 MB Vortex file with one index and one bloom filter for the closed one, and the originals were deleted after the delay we set. Nobody ran anything, this is the background job doing its rounds. (The compactor also logs each merge, but at this log volume the pod log only holds a few minutes, so you have to look right after an hour closes.)
Now for the question we started with: what does it cost to keep? The stream stats API reports, per stream, the bytes that came in, the bytes on disk, and the size of the index:
for t in logs metrics traces; do
  curl -s -u $AUTH "$O2/api/default/streams?type=$t" | jq -r --arg t $t \
    '[.list[].stats] | "\($t): \(length) streams, \(map(.doc_num)|add) rows, \(map(.storage_size)|add|round) MB in, \(map(.compressed_size)|add|round) MB on disk, \(map(.index_size)|add|round) MB index"'
donelogs: 4 streams, 5067137 rows, 5173 MB in, 228 MB on disk, 164 MB index
metrics: 463 streams, 21040362 rows, 17329 MB in, 161 MB on disk, 64 MB index
traces: 1 streams, 727109 rows, 674 MB in, 44 MB on disk, 13 MB index| Came in | On disk | Index | Smaller by | |
|---|---|---|---|---|
| Logs | 5,173 MB | 228 MB | 164 MB | 13x with index, 23x without |
| Metrics | 17,329 MB | 161 MB | 64 MB | 77x with index, 108x without |
| Traces | 674 MB | 44 MB | 13 MB | 12x with index, 15x without |
| Whole cluster, 15 hours | 23,176 MB | 433 MB | 241 MB | 34x with index, 54x without |
So 23 GB of telemetry from a three node cluster over fifteen hours is 674 MB in the bucket, index included. At S3 standard pricing of 2.3 cents per GB-month, a full month of this cluster is around 32 GB and under a dollar of storage. So the storage bill rounds to zero here, and the real cost of running this is the pod's CPU and memory. One detail in that table to notice: the logs index is not small, 164 MB against 228 MB of data, because every log body is tokenised into the full-text index. Metrics and traces have no full-text fields and their index is a fraction of the data. If you want logs cheaper still, take fields out of the full-text list.
Is it fast, though? Three questions over the last 12 hours of logs, 4.2 million rows, on this one pod:
NOW=$(date +%s); FROM=$((NOW-43200))
q() { curl -s -u $AUTH -H 'Content-Type: application/json' -X POST "$O2/api/default/_search?type=logs" \
  -d "{\"query\":{\"sql\":\"$1\",\"start_time\":${FROM}000000,\"end_time\":${NOW}000000,\"size\":5}}" \
  | jq -c '{took, total, scan_records, scan_size, idx_scan_size}'; }
q "SELECT count(*) AS rows FROM \\\"default\\\""
q "SELECT k8s_namespace_name, count(*) AS rows FROM \\\"default\\\" GROUP BY k8s_namespace_name"
q "SELECT _timestamp, k8s_namespace_name, body FROM \\\"default\\\" WHERE match_all('readonly database')"{"took":66,"total":1,"scan_records":4219547,"scan_size":4159,"idx_scan_size":135}
{"took":61,"total":4,"scan_records":4219547,"scan_size":4159,"idx_scan_size":135}
{"took":31,"total":5,"scan_records":28135,"scan_size":27,"idx_scan_size":0}took is milliseconds, scan_size is the uncompressed size in MB of what the query touched. The count comes from file metadata and took 66 ms. The group-by is the columnar scan reading one column across all 4.2 million rows, 61 ms. The full-text search is the query funnel from earlier in one line: 28,135 rows in the files it had to open, out of 4.2 million, 27 MB out of 4,159, in 31 ms, because the index threw away every file without a hit and then narrowed the rest to the matching rows. This is one pod in a VM on a laptop with 12 hours of data, so treat these milliseconds as a rough shape rather than a benchmark. Watching it skip 99 percent of the data on my own laptop was really fun, though.
One last thing I wanted to see was a restart. A Helm upgrade mid-run restarted the pod for me (kubectl -n openobserve rollout restart statefulset/o2-openobserve-standalone does the same), and the startup log walked through the WAL replay we saw in the write path:
INFO ingester::wal: Scanning lock files from "./data/wal/logs"
INFO ingester::wal: Clean orphan par files done
INFO ingester: Found 5 wal files to replay
WARN ingester::wal: replay wal file: ".../logs/1788326948372735.wal" done, batch_num: 6, took: 4 msNothing was lost. Two things that cost me time, neither about OpenObserve: kiac load image checkout:demo stores the bare name while the kubelet looks for docker.io/library/checkout:demo, so tag with the full name. And if you wrap Go's slog.Handler to inject trace ids, implement WithAttrs and WithGroup too, or logger.With(...) silently drops your wrapper.
Sharp edges #
Laptop to cluster works. One Helm install, and the same binary that runs on a laptop was ingesting a whole cluster at under 600 MiB of memory. Cluster mode is a bigger commitment: PostgreSQL, NATS, object storage and the roles chart.
Know what is off by default. The memory cache, the circuit breakers and synthetics are off, the WAL is not fsynced per batch, and the docs lag the code on several defaults.
Vortex is young here. Faster on row fetch and larger on disk in the vendor's own numbers, in the open-source build only since July, pinned to a git revision. Try it on a test cluster, watch the release notes before production.
PromQL has gaps. OpenObserve does not run Prometheus's engine, it has its own PromQL evaluator, and histogram_count, histogram_sum, histogram_fraction, sort, sort_desc and the @ modifier are not implemented in it yet. Point an existing Grafana dashboard at it and test before you switch.
Wrapping up #
We followed a pod log line into a Vortex file and its index, watched queries prune down to the rows they needed, and saw fifteen hours of a whole cluster's telemetry, 23 GB of it, sit in 674 MB on disk with every field queryable.
Give it a try on a test cluster and tell me how it goes, I am @SaiyamPathak on X and LinkedIn, and I would especially like to hear whether the SLO alerts update for you on PostgreSQL. If you hit the same sharp edges I did, the notes above should save you an evening.
Links #
- Companion repo with the values files, demo app, manifests and step-by-step README: https://github.com/saiyam1814/openobserve-k8s-demo
- OpenObserve docs: https://openobserve.ai/docs
- Helm charts (standalone and collector): https://github.com/openobserve/openobserve-helm-chart
- 1.0.0-rc1 release: https://github.com/openobserve/openobserve/releases/tag/v1.0.0-rc1
- OpenObserve vs ClickHouse benchmark (vendor-run): https://openobserve.ai/blog/openobserve-vs-clickhouse-one-billion-logs-benchmark/
- Vortex file format: https://vortex.dev
- Grafana Labs Observability Survey 2026: https://grafana.com/observability-survey/
- kiac: https://github.com/saiyam1814/kiac
Saiyam is working as Head of DevRel at vCluster Labs. He is the founder of Kubesimplify, focusing on simplifying cloud-native & AI infrastructure. He is KubeCon Co-chair and has worked on many facets of Kubernetes, including machine learning platforms, scaling, multi-cloud, & managed Kubernetes services. When not coding, Saiyam contributes to the community by writing blogs and organizing local meetups for Kubernetes and CNCF. He is also a CNCF TAG OpsRes Chair & can be reached on Twitter @saiyampathak.
Get new posts in your inbox.
Spotted a typo or want to improve this post? Edit on GitHub →